Appliance Health
On the Diagnostics pages, you can keep track of appliance services, hardware faults, and performance metrics.
Note: If you are using your SQL Server deployment (not the SQL Server version that ships with the appliance),
then the SQL Server metrics are not displayed on the Health dashboard.
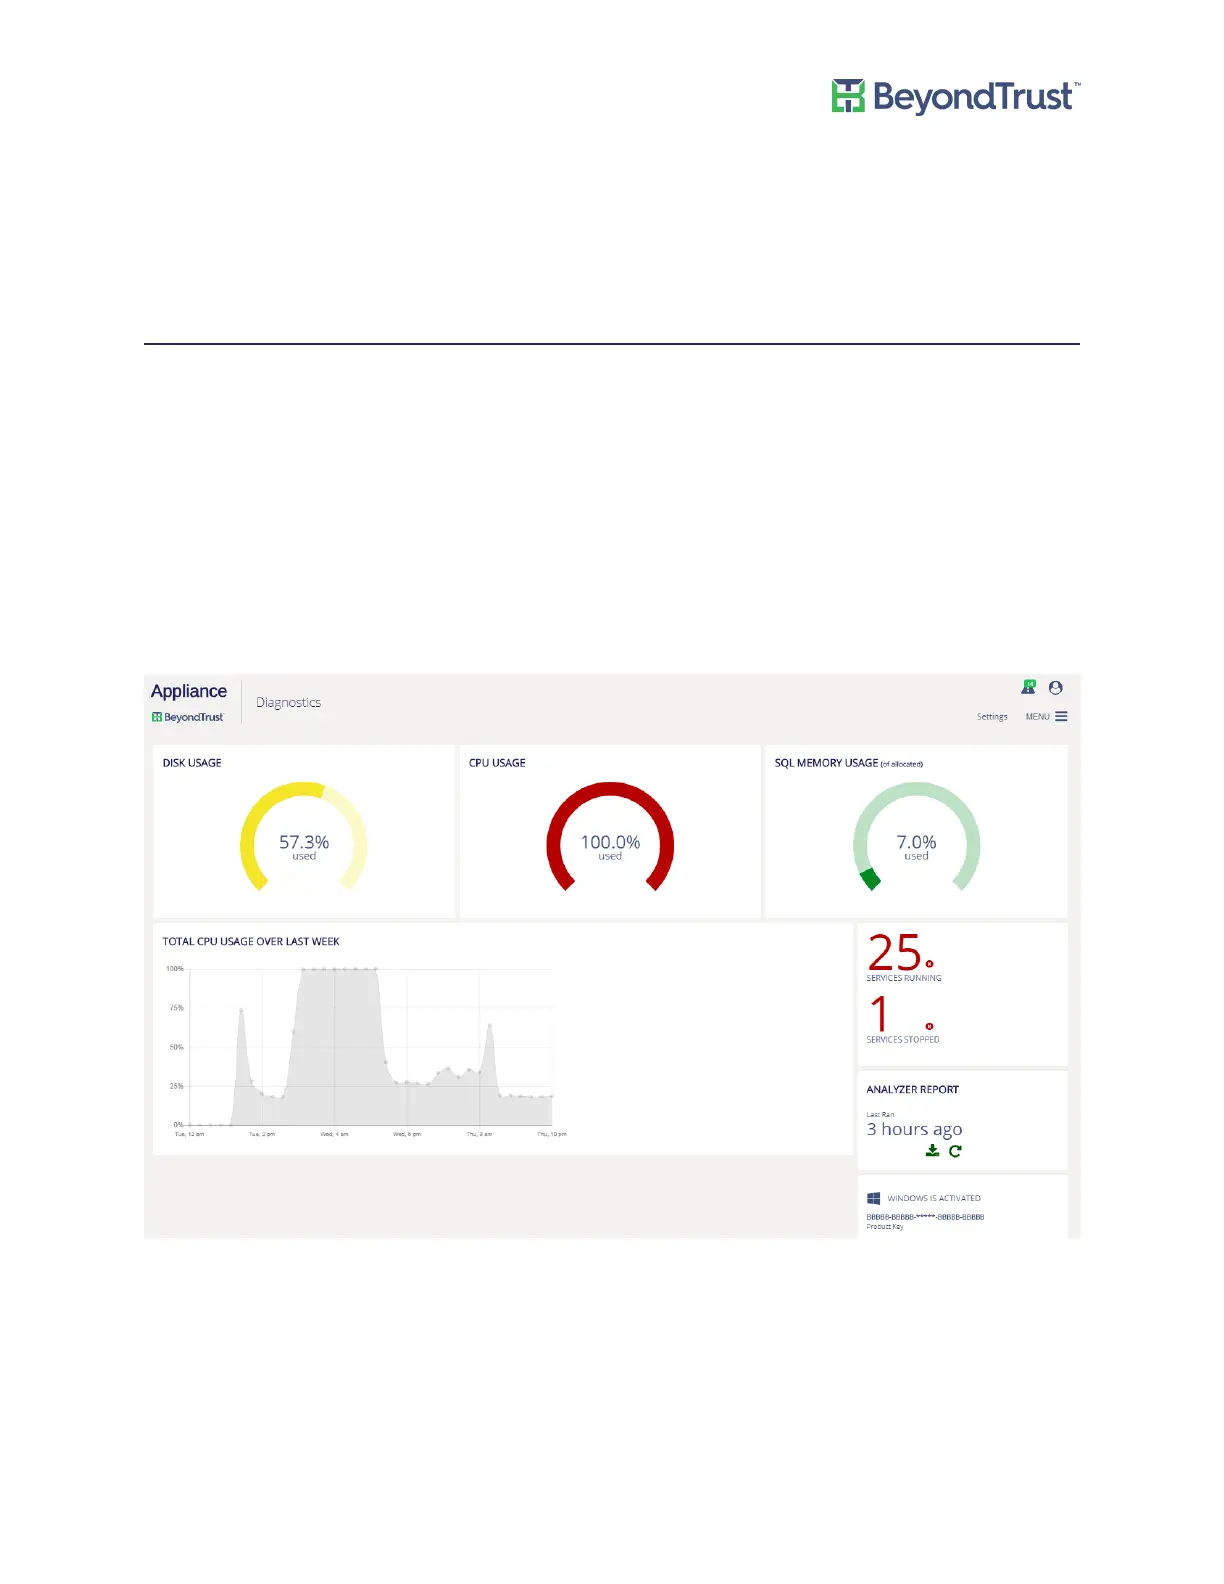
Health Dashboard
View dynamic, live appliance metrics including:
• CPU usage
• SQL Server CPU usage
• SQL Server memory
• Used disk space on the C: drive. Note that on a UVM50 additional drives are displayed (O, N, and M).
• Services running and stopped
• Analyzer reporting - Download BeyondTrust's BTAnalyzer reports. View health metrics on BeyondTrust
components and services running in your environment.
Appliance Health
UVM Appliance User Guide 25 © 2018. BeyondTrust Software, Inc.