PV Simulation
Typically, a solar array is connected to an inverter, which converts the panel’s output from DC to AC. Due to varying
environmental conditions and the nonlinear output of solar cells, many inverters use a maximum power point tracking
mechanism to maximize the power generated from the solar panel. Using an actual solar array to test inverters is not
cost-eective and environmental conditions are dicult to control in this scenario.
The MR power supply can simulate the output of a solar array with its solar array simulator (SAS) function. Combined
with the SAS application software, users can simulate the I-V curve of dierent arrays under various irradiance conditions
while measuring and validating the eectiveness of the inverter’s MPPT algorithm.
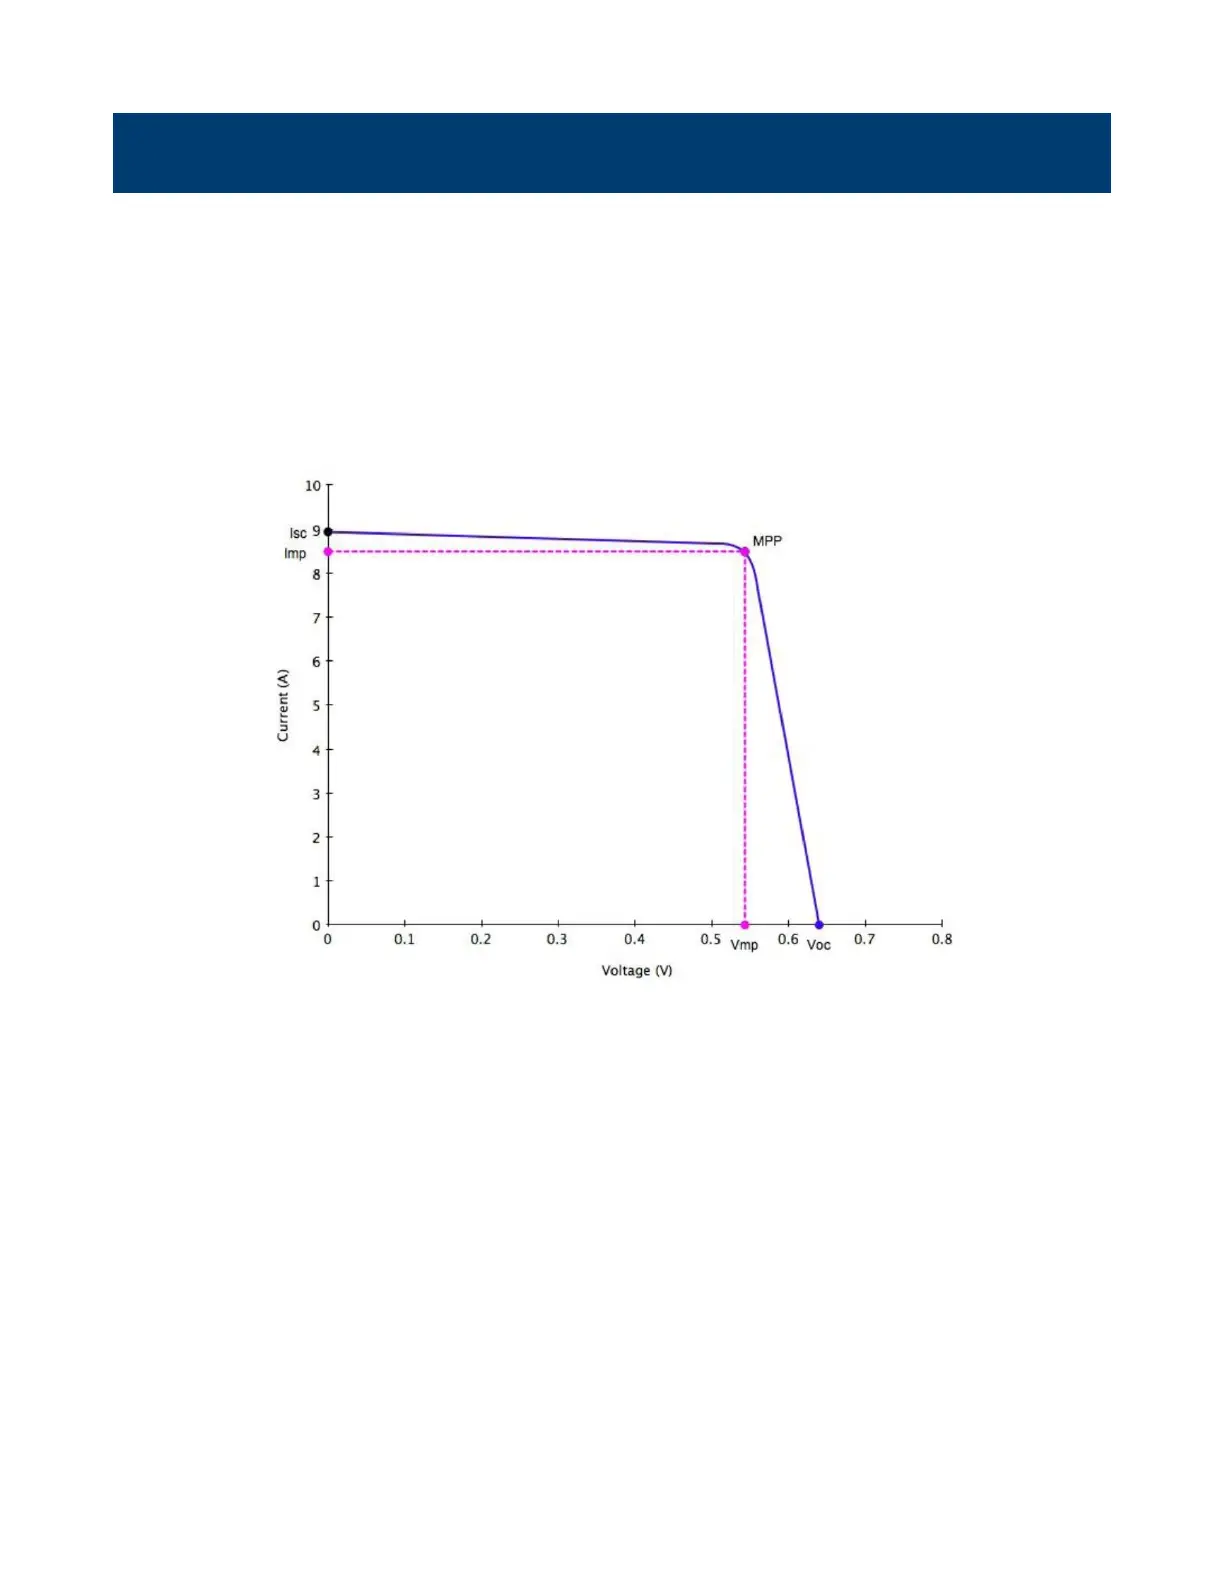
Figure 5.1 PV Simulation Curve
Solar arrays consist of multiple solar cells characterized by a complex voltage and current prole that is represented in
an I-V curve. The I-V curve of a solar array can be generated automatically or manually using one of the following two
methods:
a. Automatically generate the I-V curves by specifying the type of regulation for testing, and the material types such
as cSi and TF. The software supports testing against EN50530, SANDIA, and NB/T32004 regulation standards. Up
to 101 sets of curve parameters can be created and downloaded to the MR supply’s non-volatile memory or entered
directly from the front panel. Based on these input parameters, the power supply will then automatically calculate
the I-V prole.
b. Manually generate the I-V curve by creating a user-dened table of points in the SAS software. Up to 4096 I-V points
can be downloaded to the MR supply’s non-volatile memory.
Once one of these I-V curves has been selected and set from the front panel, the power supply will operate in PV mode
and output a voltage and current value according to the active I-V prole and load conditions. Dierent points on the
I-V curve will be output in 1 ms intervals to test the inverter’s MPPT eciency. To create a user-dened table of I-V
points and simulate a change in irradiance conditions (e.g. cloudy or rainy day), the PV supply must be controlled by