4-14 Taking Measurements and Analyzing Data
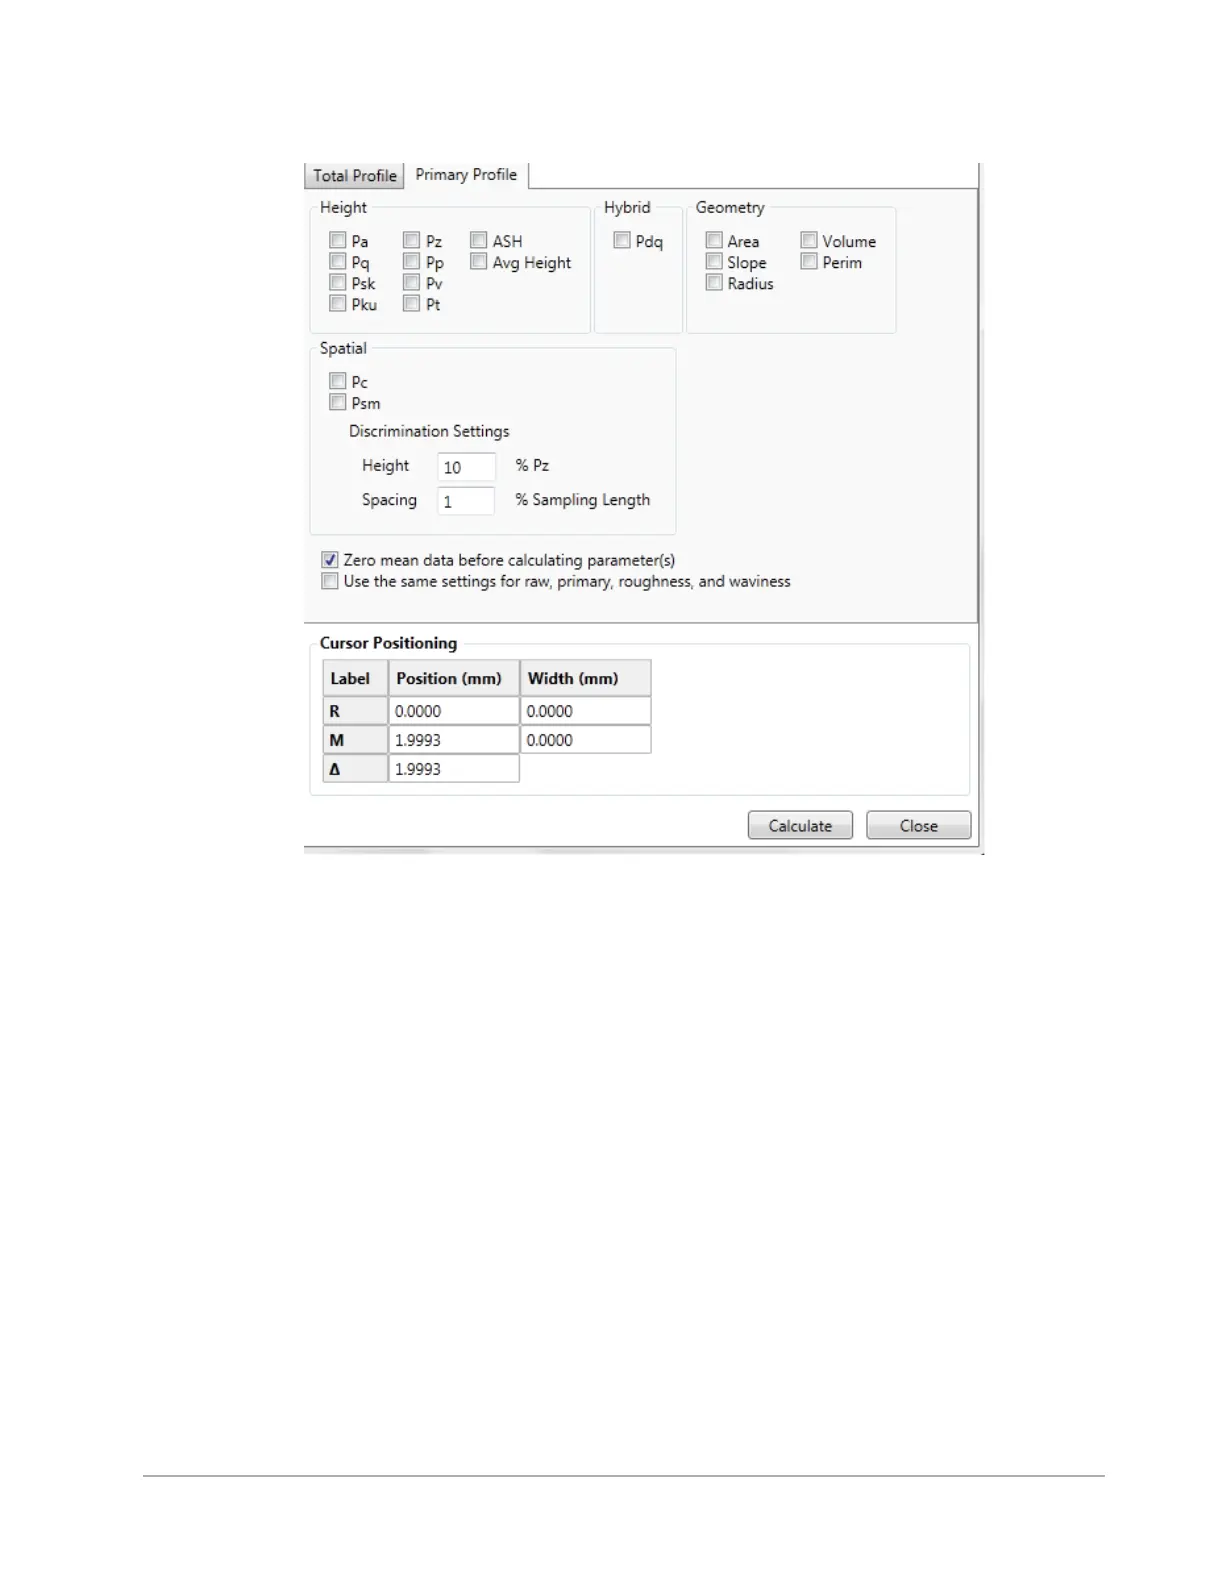
Figure 4-17: Analytical Functions window
4 Select your analytical functions and then enter the positions and bandwidths of the cursors that define the
area in which the analytical functions should be calculated.
5 Click Calculate.
SETTING THE CURSOR LOCATIONS AND
BANDWIDTHS
The red reference (R) cursor and green measurement (M) cursor in the Data Analysis Display define
the portion of the profile trace on which to calculate analytical functions on the measurement results
(see Figure 4-18). You can adjust the bandwidth at each cursor to average the data points within that
cursor’s bandwidth. This is especially useful for average step height measurements.
 Loading...