Taking Measurements and Analyzing Data 4-15
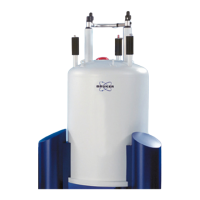
Figure 4-18: 2D Profile of the Data Analysis Display Showing the R and M Cursors
To change the position of each cursor on the measurement data, click on it and then drag it with the
mouse.
To change the bandwidth of a cursor, click it to display small boxes that you can then drag. To
reposition the cursors while maintaining the same distance between them, click on one of the cursors,
and then hold down the
Alt key while dragging that cursor. The second cursor moves along with it.
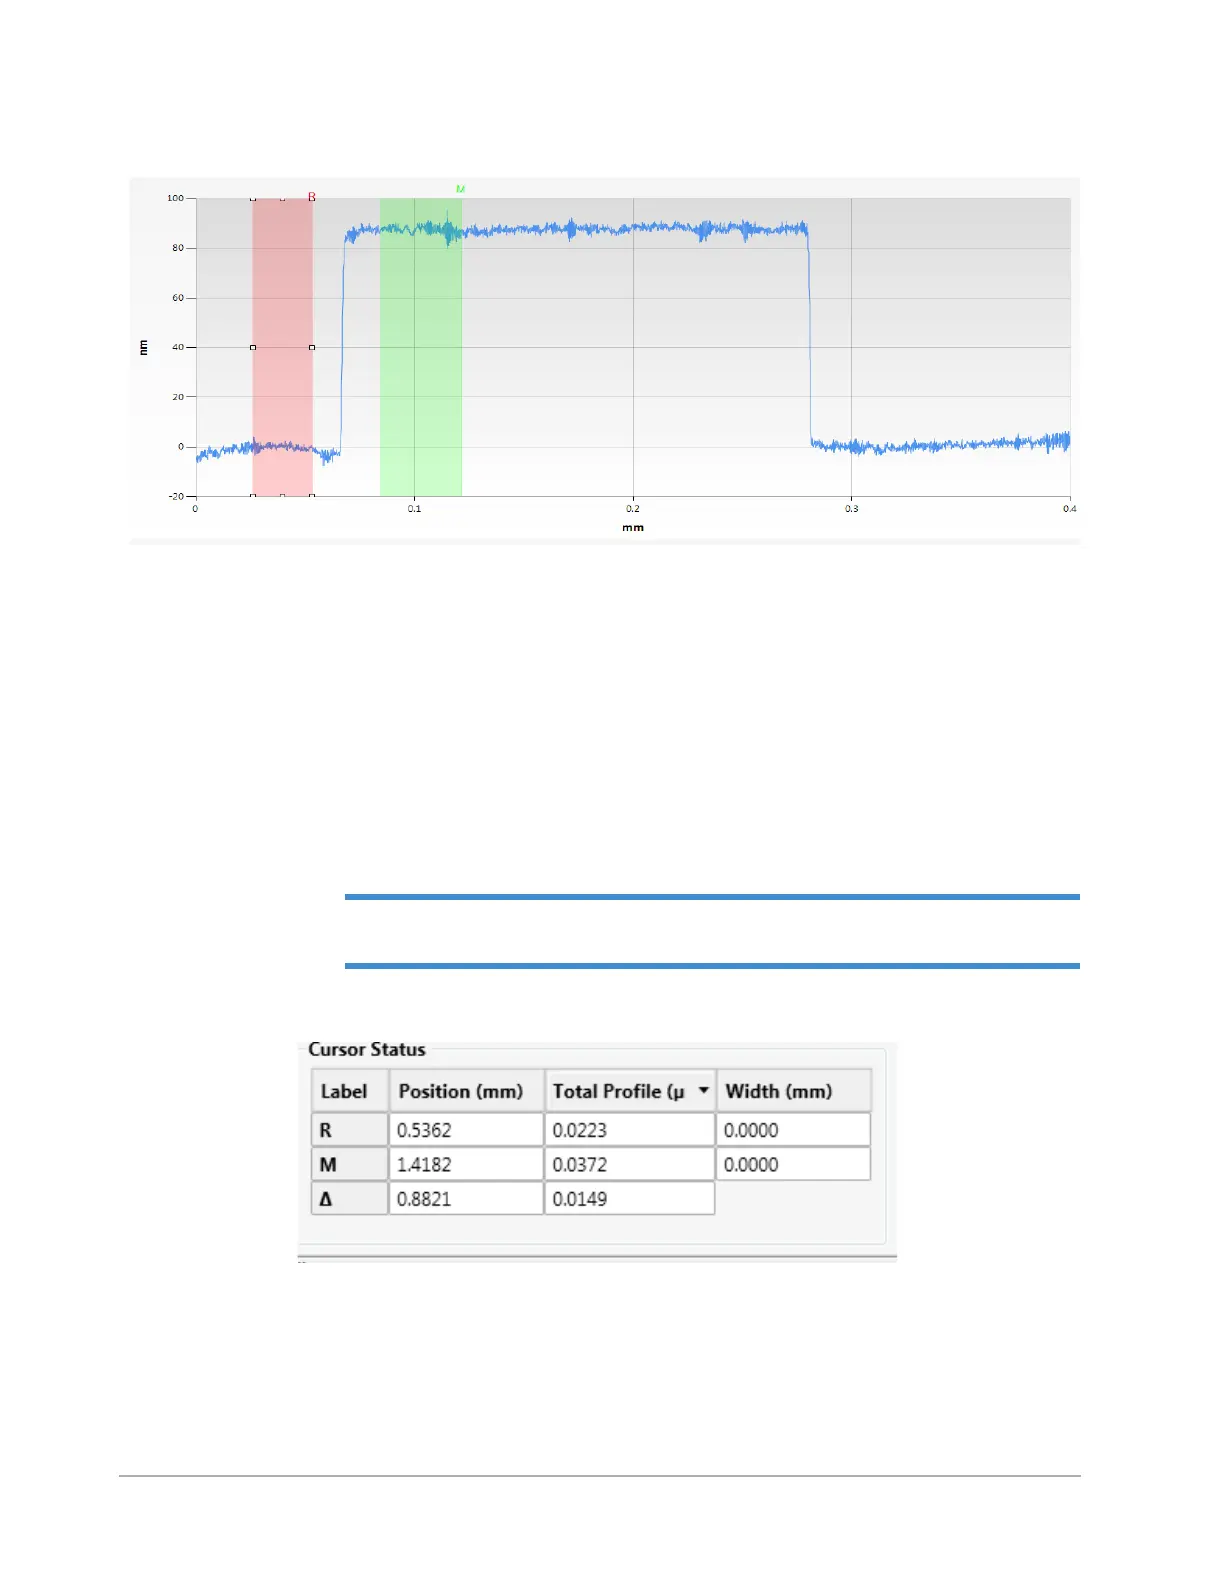
The locations of the R Cursor and M Cursor and their bandwidths appear in a box at the bottom of
the Data Analysis window (see Figure 4-7). To change these settings, type in new values and press
Enter.
NOTE – The numbers in the Cursor Status box indicate the points at which the cursors
intercept the profile trace in relation to the horizontal scale.
Figure 4-19: Cursor Status Box