User Manual – Rev AJ California Instruments
4.6.2.2 Analyzing waveform data
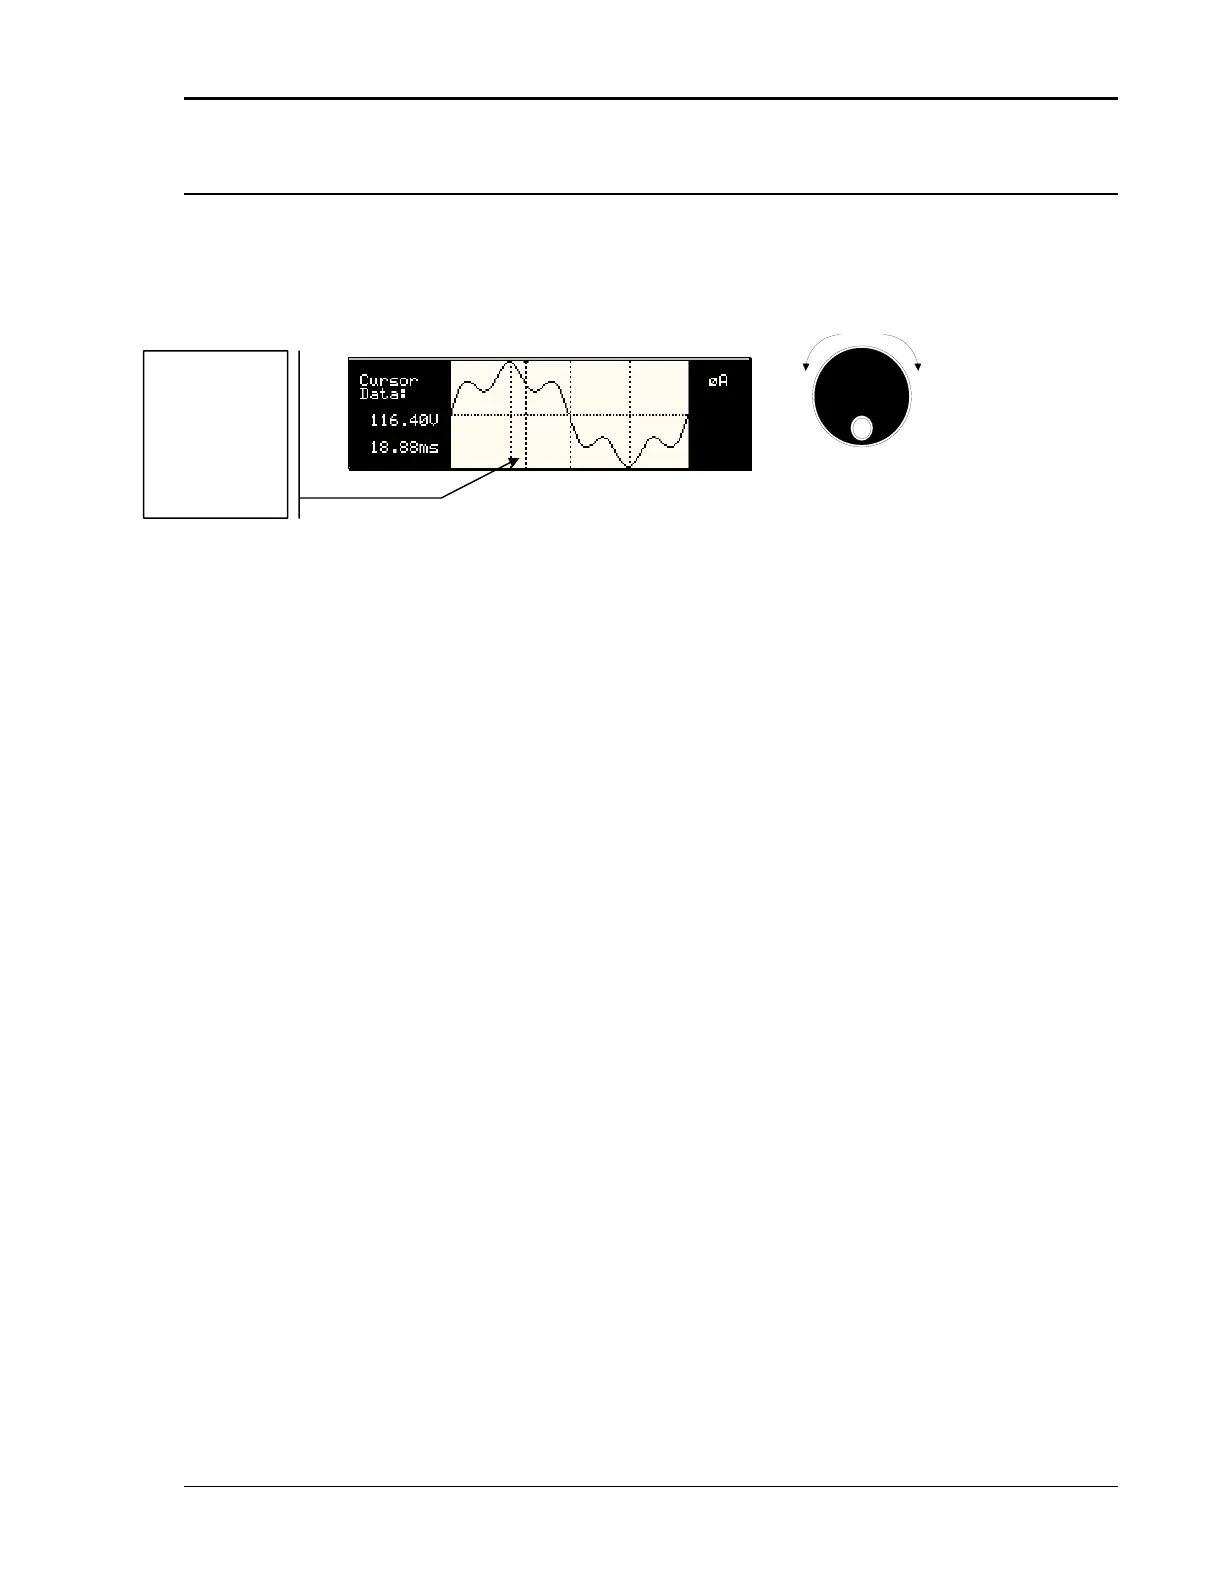
The data displays available for acquired waveform data allow you to scroll through the entire
acquisition buffer. For waveform displays, the knob can be used to scroll through the display
horizontally. The UP and DOWN cursor keys have no effect in this display mode.
Counter
Clock
wise
Clock
wise
INCRDECR
The acquisition buffer may be longer than the selected horizontal scale in which case only a
portion of the acquisition window will be visible. The left portion of the LCD display is used to
read out the data under the vertical cursor. This cursor is a dotted line that can be moved using
the knob. If the left or right edge of the display window is reached, the entire display will shift so
the cursor always remains visible. The time from the trigger point to the vertical cursor is
displayed in the left hand portion of the LCD in ms. Also displayed here are the absolute voltage
and/or current value under the cursor.
To change the horizontal display scale without re-triggering an acquisition, press the ENTER
key to return to the HARMONICS/TRACE ANALYSIS screen, change the SCALE value, move
the cursor to the VIEW field and press ENTER. This will display the same data set at the new
scale without triggering a new acquisition.
Readouts on
left track the
vertical curso
the
r
osition on th
waveform.
Trigger point i
at 0.0 ms.
e
s
Figure 4-38: Scrolling Through Acquired Waveform Data
MX Series 131