112 Chadwick-Helmuth Company, Inc.
Chapter 5 - General Operation
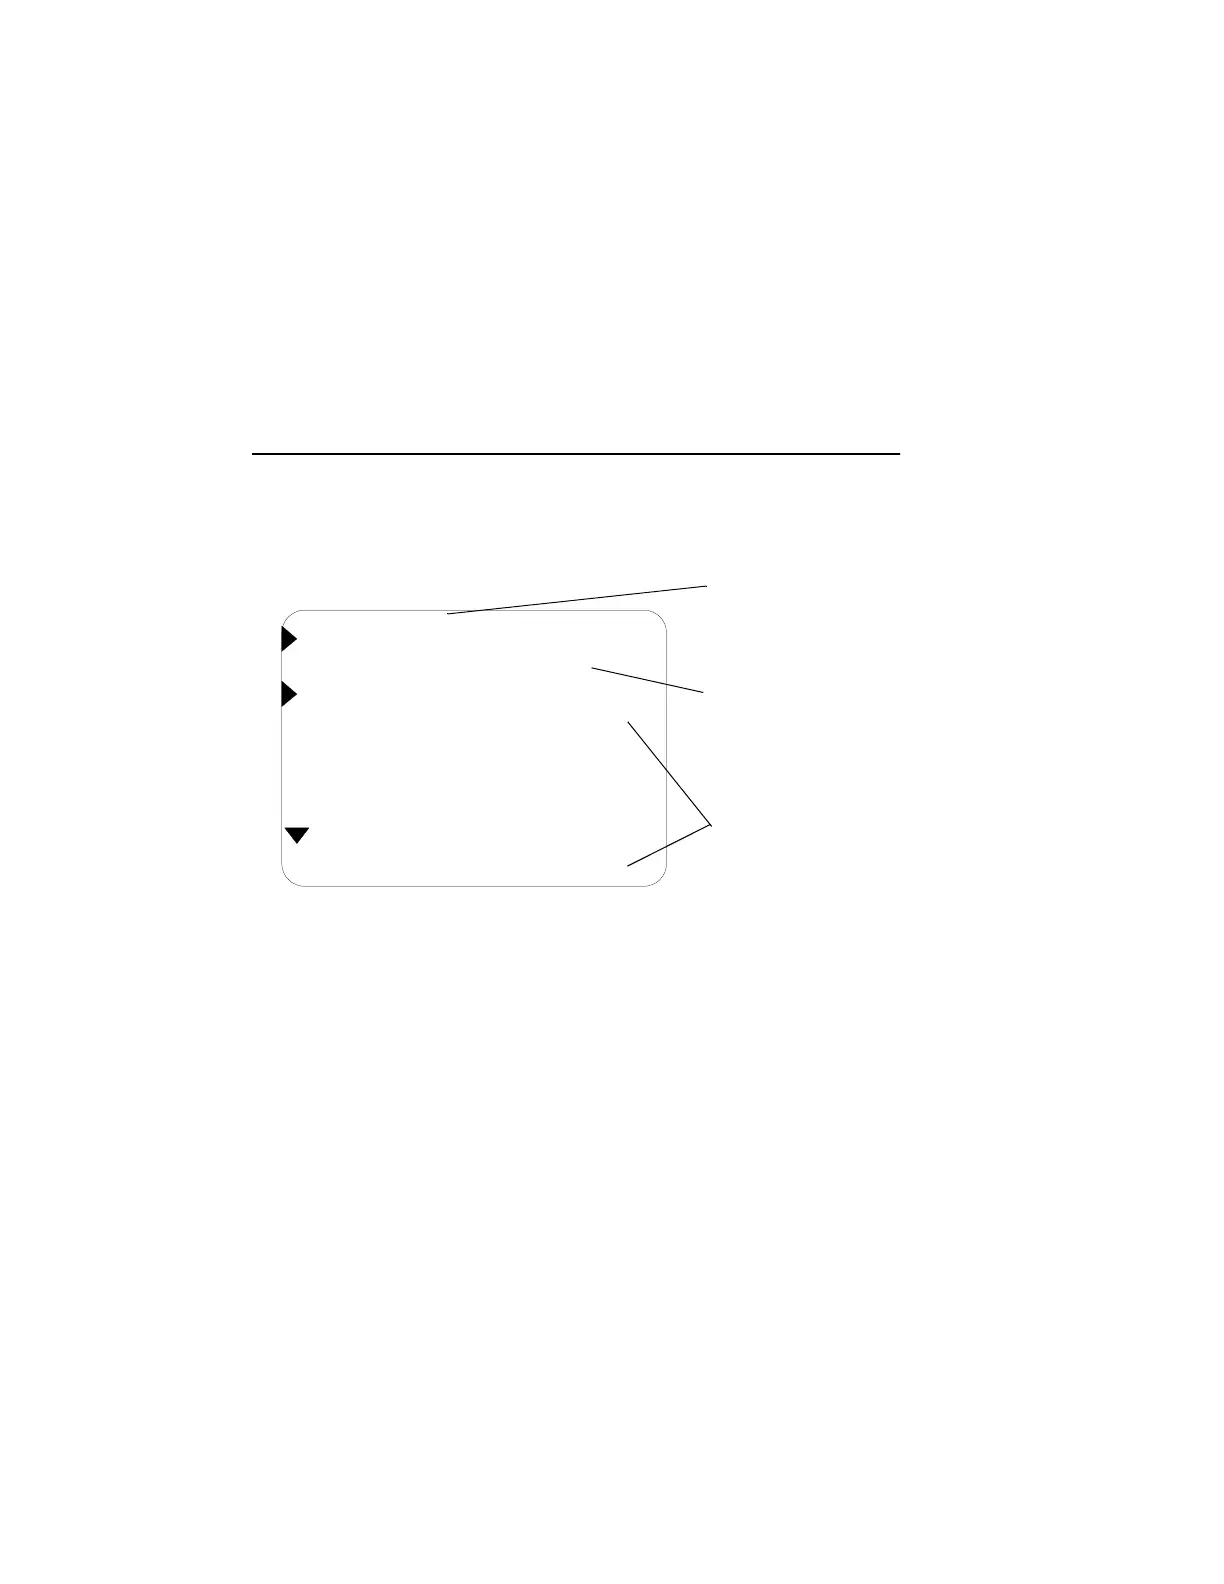
After the Vibrex 2000 has finished collecting spectral data, the list of
peaks displays on screen, that is, the Spectrum Peaks screen (see
below).
3. If a down arrow displays, more peaks are available that did not fit on
the initial screen. In this case, press the adjacent context key to list
additional peaks. Note that details of this screen on the
Vibrex 2000 Plus may differ.
NOTE: The Vibrex 2000 Plus displays the Spectrum View screen
first. See Section 5.6.4 “Spectrum Viewer Feature” on page 114 for
details.
4. Press
START again to save the list in memory. The user may press
GO BACK to erase the list.
5.6.3 Order Analysis
Order analysis is a way to observe vibrations harmonically related to a
primary frequency. For example, a vibrating string (as on a violin or
guitar) has a primary frequency most associated with the sound and a host
of harmonics.
<PEAK IPS RPM>
0.91 3900
0.31 92160
0.31 46230
0.31 23115
0.31 11407
[ANNOTATE ] LIST 1
25SEP96 09:56:46 1A
USE TO ENTER
NOTES TO
ONE’S SELF
DATE, TIME, AND
CHANNEL
NUMBER
LIST OF
VIBRATION
PEAKS