Seven
™
System User’s Guide | 109
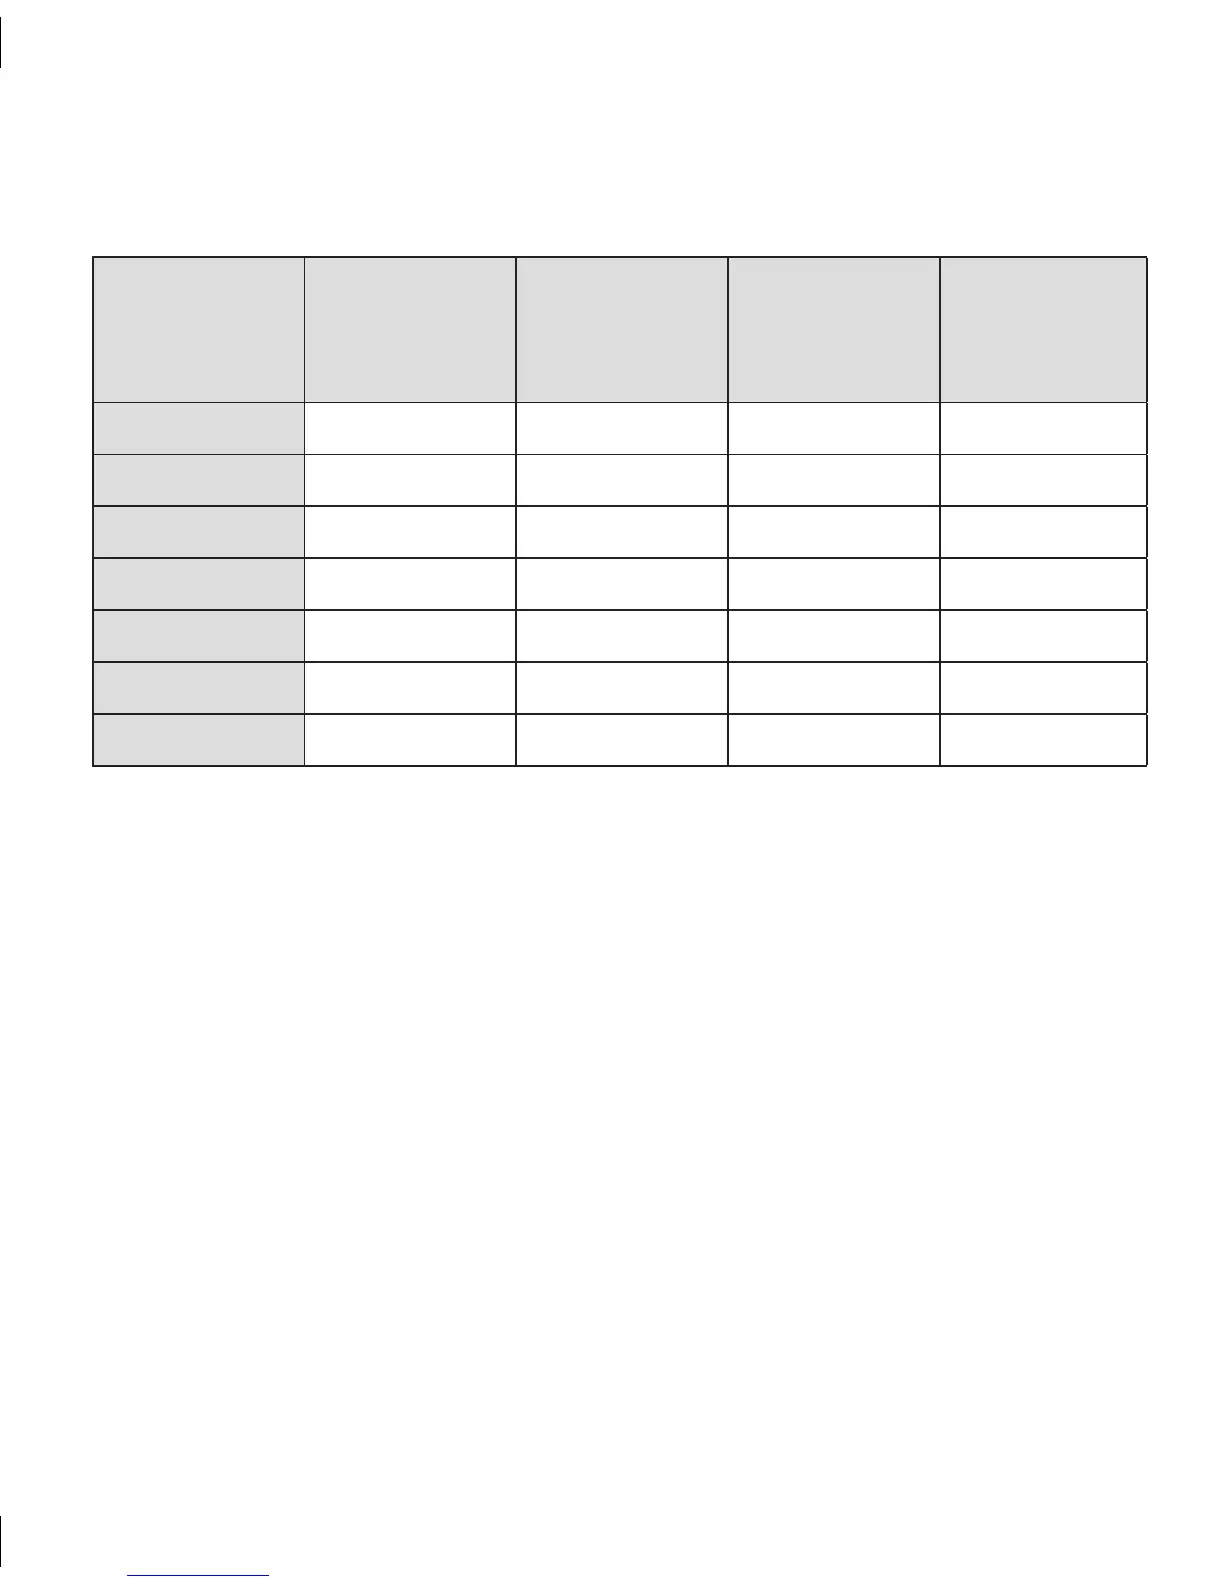
Table 1. Percentage of Seven System Results Falling Within 20, 30, and Greater Than 40
Percent of the Paired YSI Results, at Various Glucose Concentrations
YSI Readings (mg/dL)
Number of Paired
Readings
% of Seven System
Readings Within
20%*
% of Seven System
Readings Within
30%*
% of Seven System
Readings Greater
than 40%* of YSI
40-60* 36 86% 94% 6%
61-80* 170 68% 91% 5%
81-180 1087 69% 85% 6%
181-300 850 74% 91% 3%
301-350 127 72% 97% 0%
351-400 48 69% 94% 0%
Overall 2,318 71% 89% 4%
* For the 40-60 and 61-80 mg/dL range the difference is presented as the difference in mg/dL between the Seven
System and YSI, rather than the percent.
e Seven System reports glucose concentrations between 40 and 400 mg/dL. When the
Seven System determines the glucose level is below 40 mg/dL, it indicates “LOW.” If the
Seven System determines that the glucose level is above 400 mg/dL, it indicates “HIGH.”
e ability of the Seven System to accurately report these occurrences is assessed by
looking at the actual glucose concentrations (as determined by the YSI analyzer) when
“LOW” or “HIGH” is reported.
On 34 occasions the Seven System indicated the glucose reading was less than 40 mg/dL
or “LOW”. Of these, the YSI glucose reading was below 40 mg/dL 3 times. When the
Seven System read less than 40 mg/dL, the actual range of glucose readings the YSI read
at these times was 36-74 mg/dL.
ere were 13 occasions when Seven System indicated the glucose reading was above
•
400 mg/dL or “HIGH.” Of these, the YSI glucose reading was above 400 mg/dL 7 times.
e actual range of glucose readings the YSI read at these times was 302-494 mg/dL.