Seven
™
System User’s Guide | 115
CLARKE ERROR GRID ANALYSES
e Clarke Error Grid was used to determine if Seven System results are “clinically
accurate”. e Clarke Error Grid divides a correlation plot into 5 zones, which are
described in the table below.
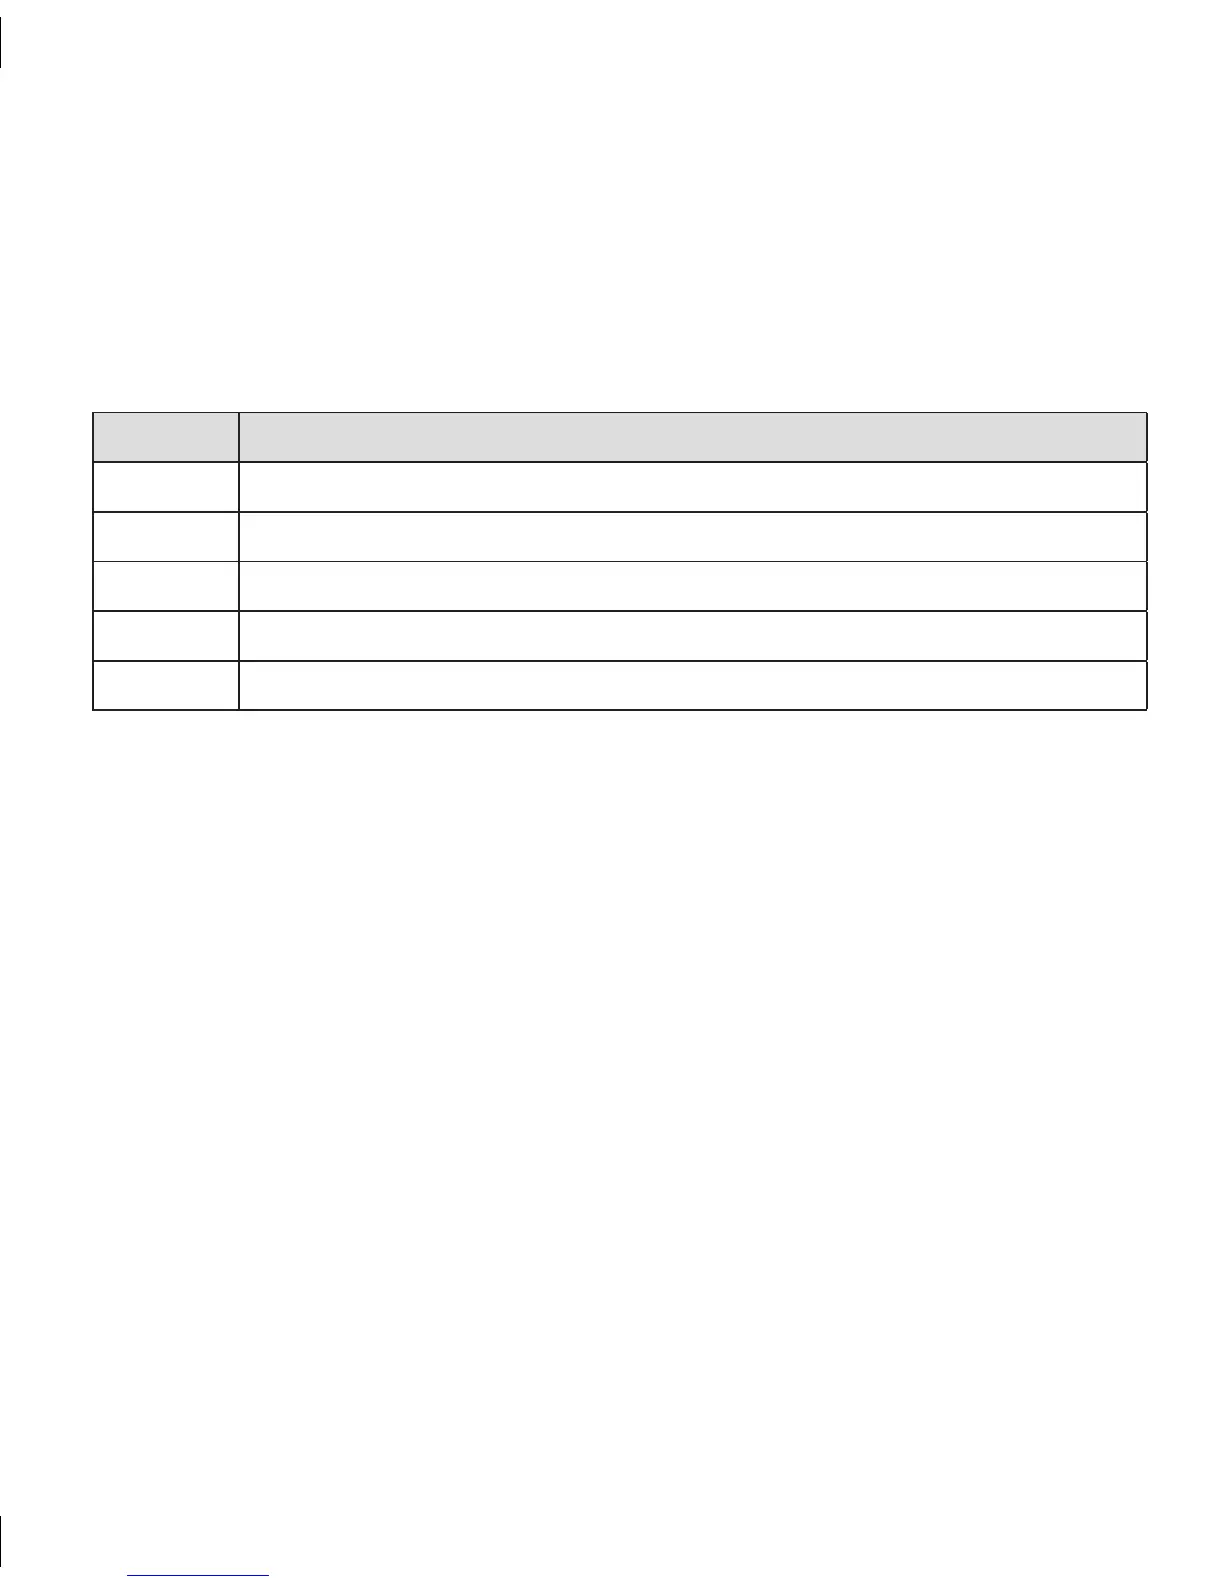
Zone Description
A Clinically Accurate, would lead to correct treatment decisions
B Would lead to benign decisions or no treatment
C Would lead to overcorrection of normal glucose levels
D Would lead to failure to be aware of and treatment of high or low glucose levels
E Would lead to inaccurate and “dangerous” treatment decisions
Results in zones A and B are considered clinically acceptable, while results in zones C, D,
and E are potentially dangerous. ey may result in clinically significant errors. e Clarke
Error Grid zones are labeled on a correlation plot in Figure 1. Each YSI result (on the
horizontal axis) is matched up with its corresponding Seven System result (on the vertical
axis). A point is recorded where the two readings intersect. ese results are based on
2,318 paired data points recorded.
Table 6. Clarke Error Grid Description