Seven
™
System User’s Guide | 117
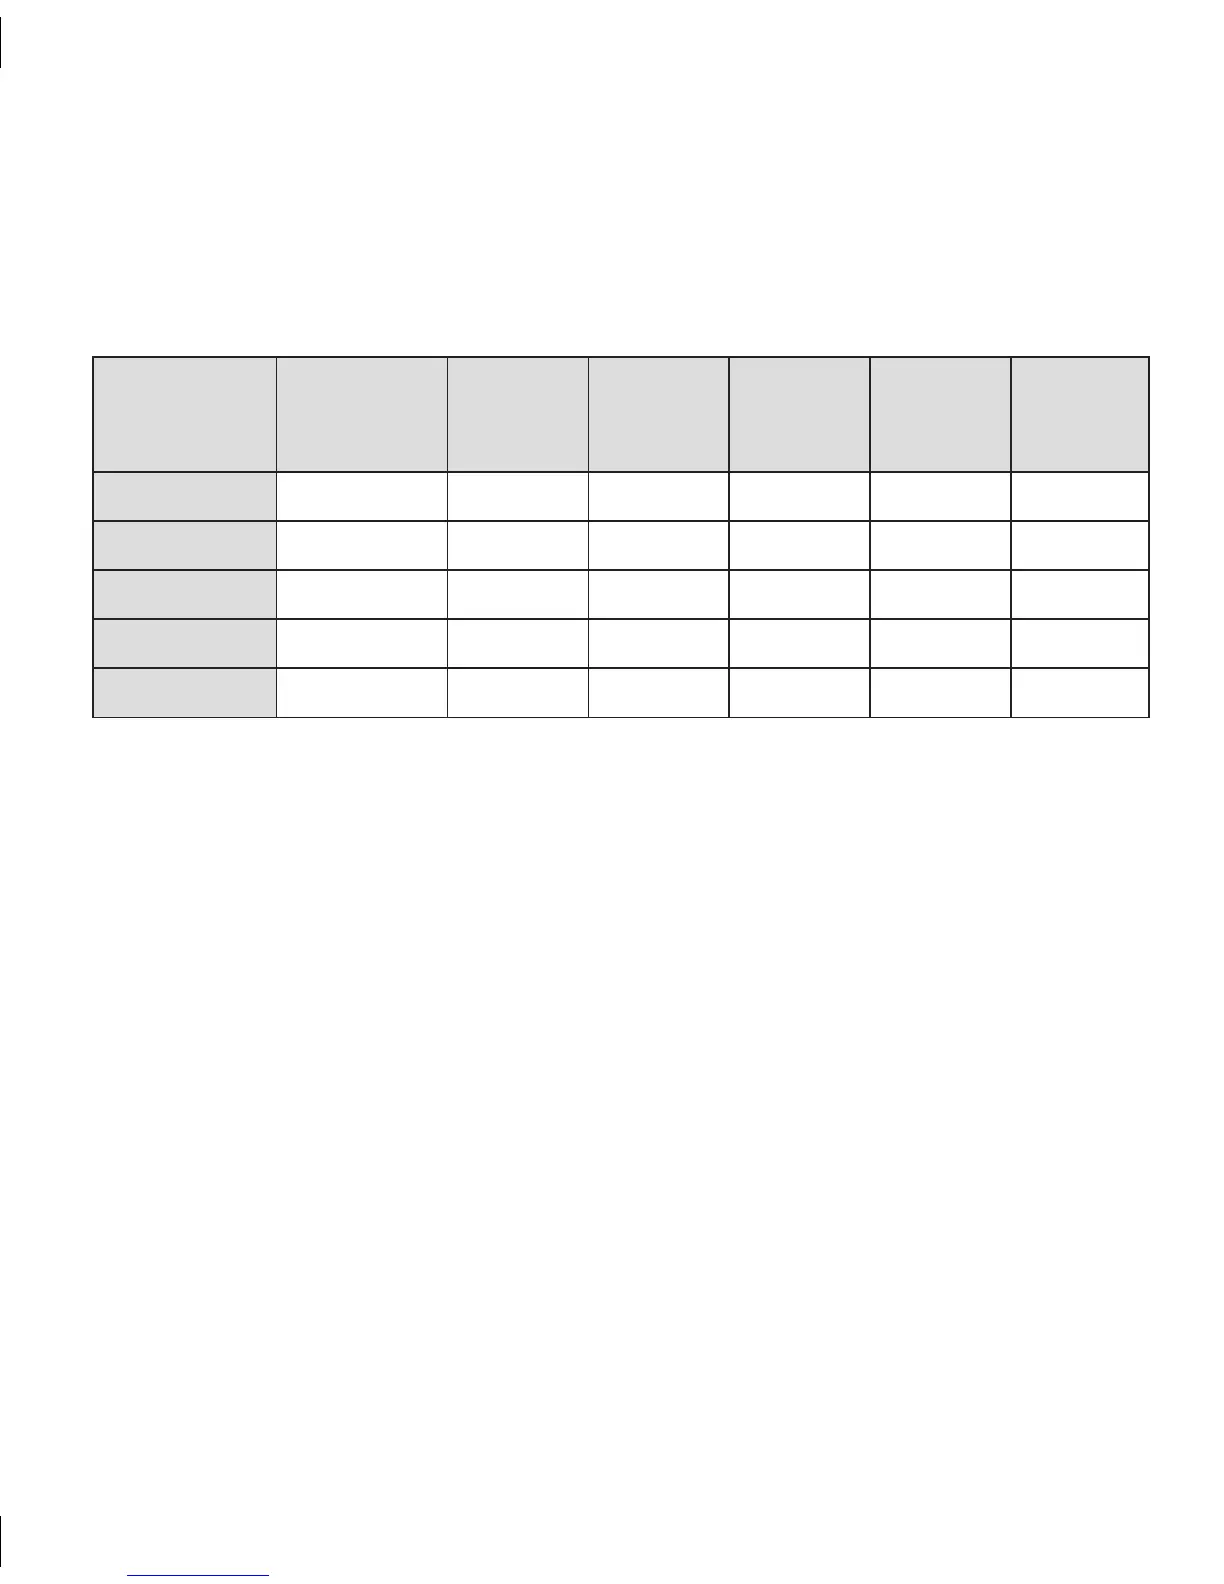
Glucose Range
(mg/dl)
Total YSI – Seven
System Pairs
A % B % c % D % E %
40-75 149 69% 15% 0% 15% 1%
76-180 1144 68% 31% 1% N/A* N/A*
181-300 850 73% 25% 1% 1 % 0%
301-400 175 71% 29% N/A* 0% 0%
Overall 2318 70% 27% 1% 2% 0%
e percentage of Seven System results in the above graph are presented in Table 6
below according to the percentage of points falling within each zone (A-E). Results are
further broken down (stratified) according to the range of glucose concentration.
*N/A means that the Clarke Error Grid does not consider the possibility of these zones in that concentration range.
Table 7. Clarke Error Grid Analysis, Stratied by YSI Glucose Concentrations
e Continuous Error Grid was also used to determine if the Seven System results are
“clinically accurate”. e Continuous Error Grid looks at how closely the Seven System
readings match to the YSI Analyzer and also how closely the Seven System glucose rate of
change (how fast the glucose rises or falls) compared to the actual blood glucose rate of
change measured by the YSI. e data is evaluated in 3 zones: clinically accurate readings,
benign errors, and clinically inaccurate readings. See the table below for the Seven System
accuracy by glucose range. ere were 2,173 paired points evaluated.