5520A
Service Manual
6-38
4. The edge rise time measured should be less than the time indicated in Table 6-26.
90%
10%
Rise time
measures
between
these two
points
om033i.eps
Figure 6-8. Edge Rise Time
Table 6-26. Edge Rise Time Verification
Calibrator Mainframe Output
Voltage Frequency
DSO
Vertical
Axis
(mV/div)
A
11801
Reading
B
Corrected
Reading
Tolerance
250 mV 1 MHz 20.0 < 300 ps
250 mV 10 MHz 20.0 < 350 ps
500 mV 1 MHz 50.0 < 300 ps
500 mV 10 MHz 50.0 < 350 ps
1 V 1 MHz 100.0 < 300 ps
1 V 10 MHz 100.0 < 350 ps
2.5 V 1 MHz 200.0 < 300 ps
2.5 V 10 MHz 200.0 < 350 ps
6-55. Edge Abberation Verification
The following equipment is needed for this procedure:
• Tektronix 11801 oscilloscope with SD22/26 sampling head
• Output cable provided with the SC600
Before you begin this procedure, verify that the SC600 is in the edge mode (the Edge
menu is displayed), and program it to output 1 V p-p @ 1 MHz. Press O to activate
the output.
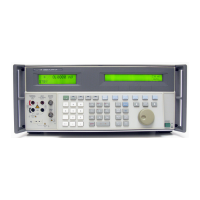
Connect the Calibrator Mainframe to the oscilloscope refering to Figure 6-7. Set the
oscilloscope vertical to 10 mV/div and horizontal to 1 ns/div. Set the oscilloscope to look
at the 90% point of the edge signal; use this point as the reference level. Set the
oscilloscope to look at the first 10 ns of the edge signal with the rising edge at the left
edge of the oscilloscope display.
With these settings, each vertical line on the oscilloscope represents a 1% aberration.
Determine that the SC600 falls within the typical specifications shown in Table 6-27.