RCS User Manual
79
Bellow the graph, you can see a list of the alarms generated. The alarms can be filtered by channel
by using the dropdown list “Filter by channel”. By clicking on an alarm of the list, a window with
detailed information will be open.
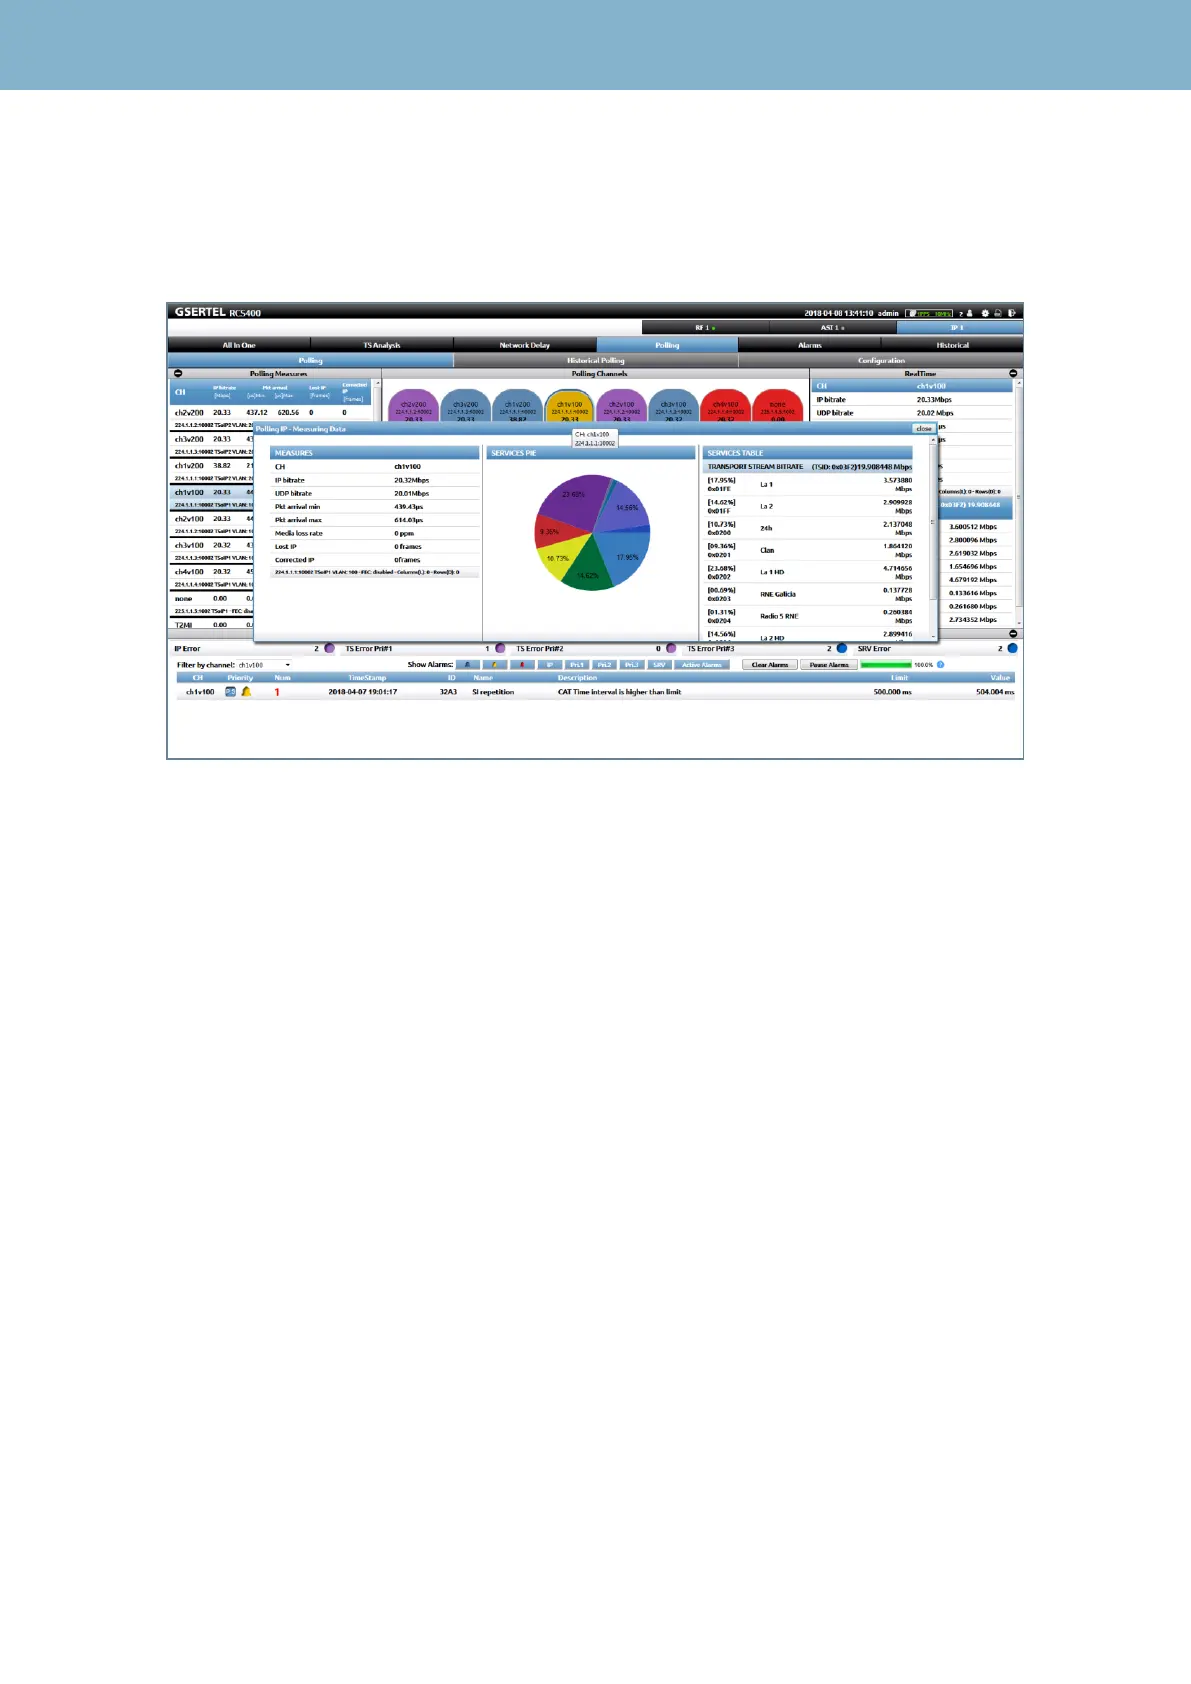
If you click on the buttons, a new window will be open:
This window shows the real-time measurements of the channel, the transport stream and services
bitrates, and a pie graph that shows all the services of the channel.
In addition, the alarms will be filtered automatically by channel.
7.2.- Historical Pollings
This feature allows you to visualize all the measurements made by your RCS with the polling
function.
Each list of measurements is identified with the date and time of the start of polling and its date and
time of completion.
 Loading...