RCS User Manual
68
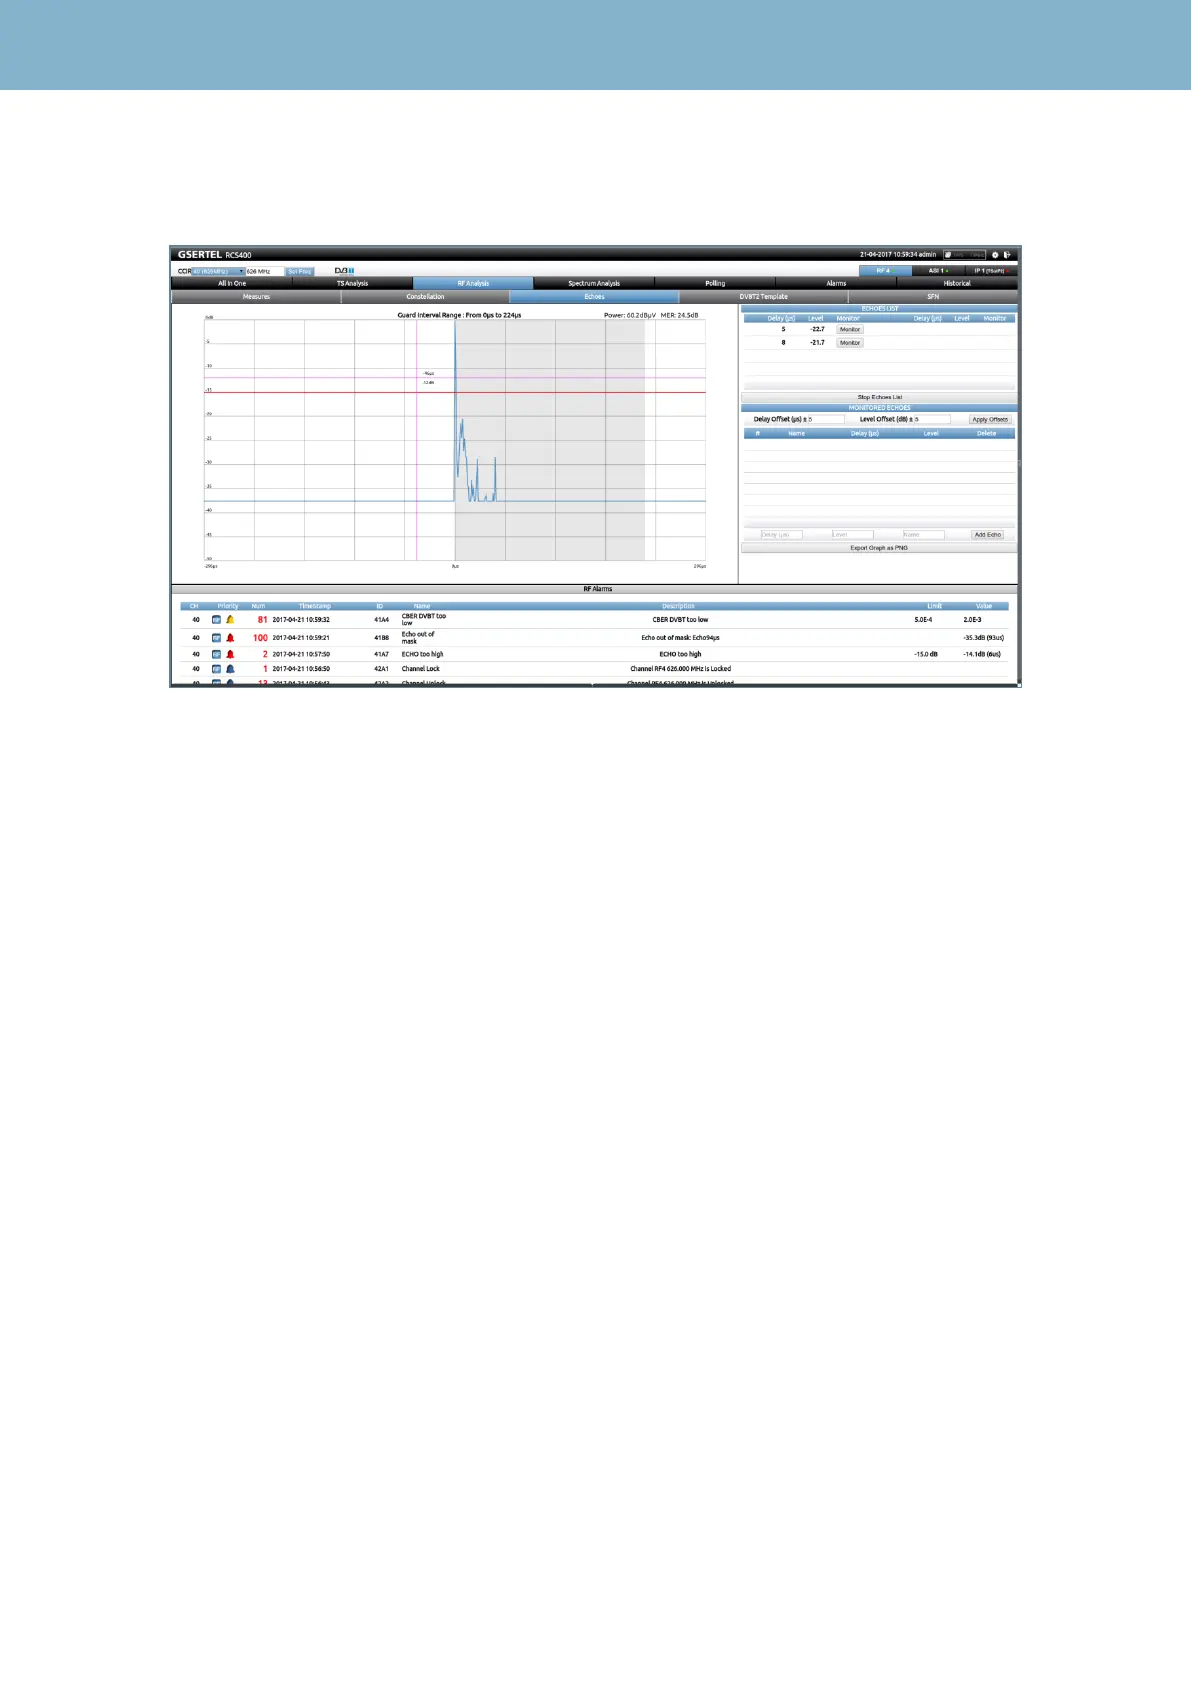
5.3.- Echoes
This feature monitors and displays the echoes of the channel and the levels and delays of each.
The pink cursor shows the delay (µs) and the level.
The graph displays the main signal and the echoes falling within the guard interval (the grey area).
For each echo, the level and the delay relative to the main signal are shown. the graph also displays
a red line that corresponds to the threshold above which shows the system generates an alarm
echoes. The value of the threshold is configured by the user (see section 1.5.1.- Alarms Profiles)
On the right side of the echoes graph, it is displayed a list that shows the echoes with level superior
to -30dB, and the level and display of each one.
In addition, this feature allows to create individual masks for each echo. There are three ways to
create a mask:
Click on the “Monitor” button, placed on the right of each echo of the echoes list.
Placing the cursor on the point of the graph that we want to monitor and clicking
Entering the delay, the level, and the name in the labels placed on the button and clicking on
“Add Echo”
In any case, the mask will be created with the values of level offset and delay offset indicated in the
“Level offset” and “Delay offset” labels.
Each mask has a name (the default name is “Echo” followed by the delay).
All the individual masks are shown in the lower list.
Bellow the masks list, there is a button that allows to save the graph in .png image format.
 Loading...