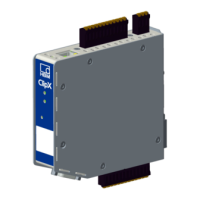
Electrical connections, LEDs
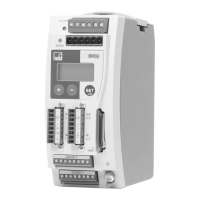
ClipX
a4643-1.0 HBM: public 53
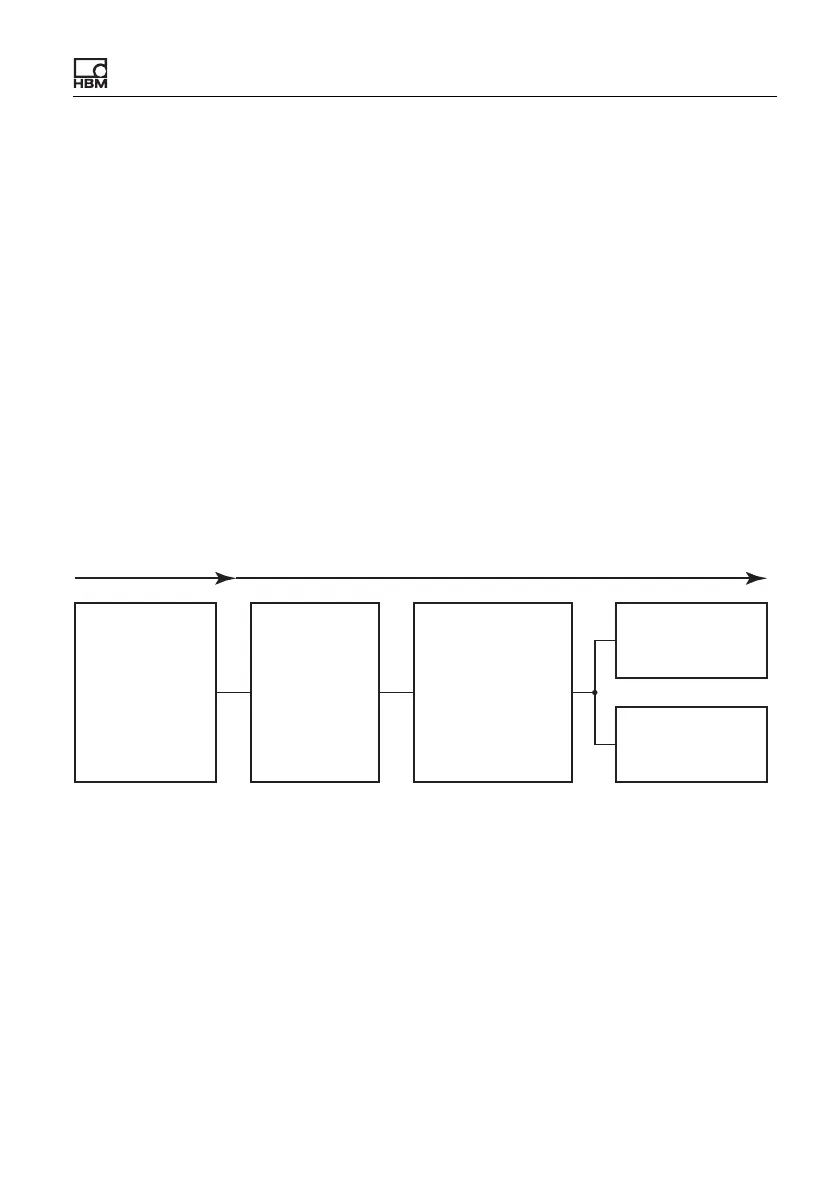
6.11 Signal propagation times within the ClipX and over the
ClipX bus
The various modules in the ClipX are combined into a number of groups, each
with fixed cycle times. This makes it easier to calculate the total propagation
time of a signal. The following diagrams indicate the propagation times of the
various groups as well as any potential additions you might need to allow for the
hardware of inputs/outputs. To calculate the maximum propagation time of sig-
nals running through more than one group, such as min/max values obtained
from calculated channels, simply add together the propagation times of the
respective groups.
Pay attention to the sequencing of the analysis within a group. If source signals
are formed only later in the group, this will double the propagation time until the
result is available.
Group 1: Measured values
Fig. 29: Minimum propagation time for group 1: 52µs plus A/D converter conver-
sion time
A/D converter
(ADC)
Filter
1)
ADC unfiltered
ADC filtered
Field value (el. value)
Gross value
Net value
Minimum
2)
Maximum
2)
Peak-to-peak
2)
Limit value switch
2)
Analog output
3)
min. 52 μs
1)
Filter off: 0 s; Bessel filter: 0.43/fg; Butterworth filter: 0.66/fg; The result is time in seconds for an
output signal of 50% of the full scale value with a jump at the input.
2)
These signals can also use other sources. The phase delays of the source signals must then be
added.
3)
If the analog output is to output a value from this group, you must add on 52 μs. If you are using
a source from a different group, you must add the phase delay of the source signal to the 52 μs.
260 μs