Revision 4 Foundation Fieldbus RMA803 Remote Indicator User's Guide Page 25
4.6 Advanced Displays
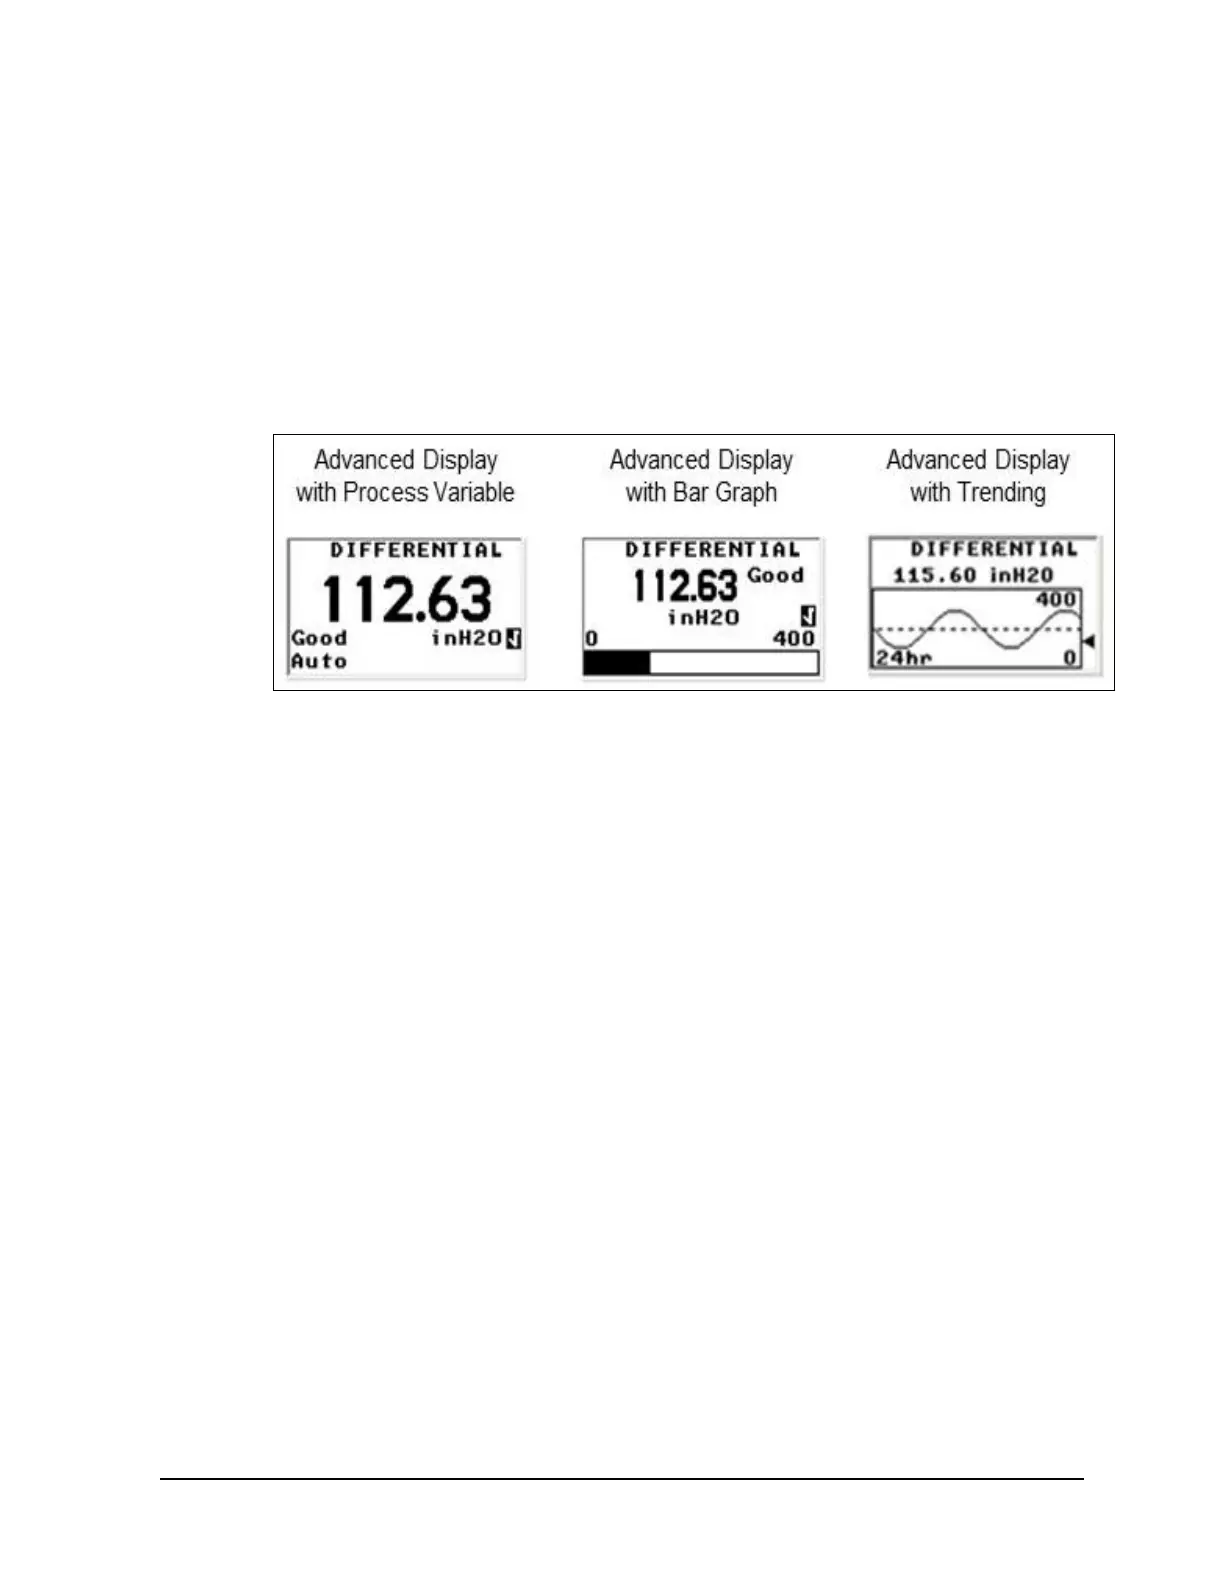
As shown in Figure 8, the Advanced Display provides three formats. Figure 8 lists and describes the
fields in each of the three Advanced Display formats. Essentially, all three formats provide the same
information, but with the following differences:
• Bar Graph. User Configurable 126 segment Bar Graph with range settings. The Bar Graph displays
the current value of the configured PV.
• PV Trend. User-configurable display period from one hour to 24 hours. The chart displays
minimum, maximum, and average of the configured PV over the selected trend period.
Figure 8: Advanced Display Formats with the Process Variable
 Loading...