NetCol5000-A 42 kW Air Cooled In-row Precision Air
Conditioner
User Manual
Huawei Proprietary and Confidential
Copyright © Huawei Technologies Co., Ltd.
6 FAQ
6.1 Querying Temperature and Humidity Curves
Context
The T/H Curve screen displays temperature and humidity curves showing the recent
temperature and humidity changes. You can choose to display the curves showing data
changes of recent one hour, one day, seven days, or 30 days.
Procedure
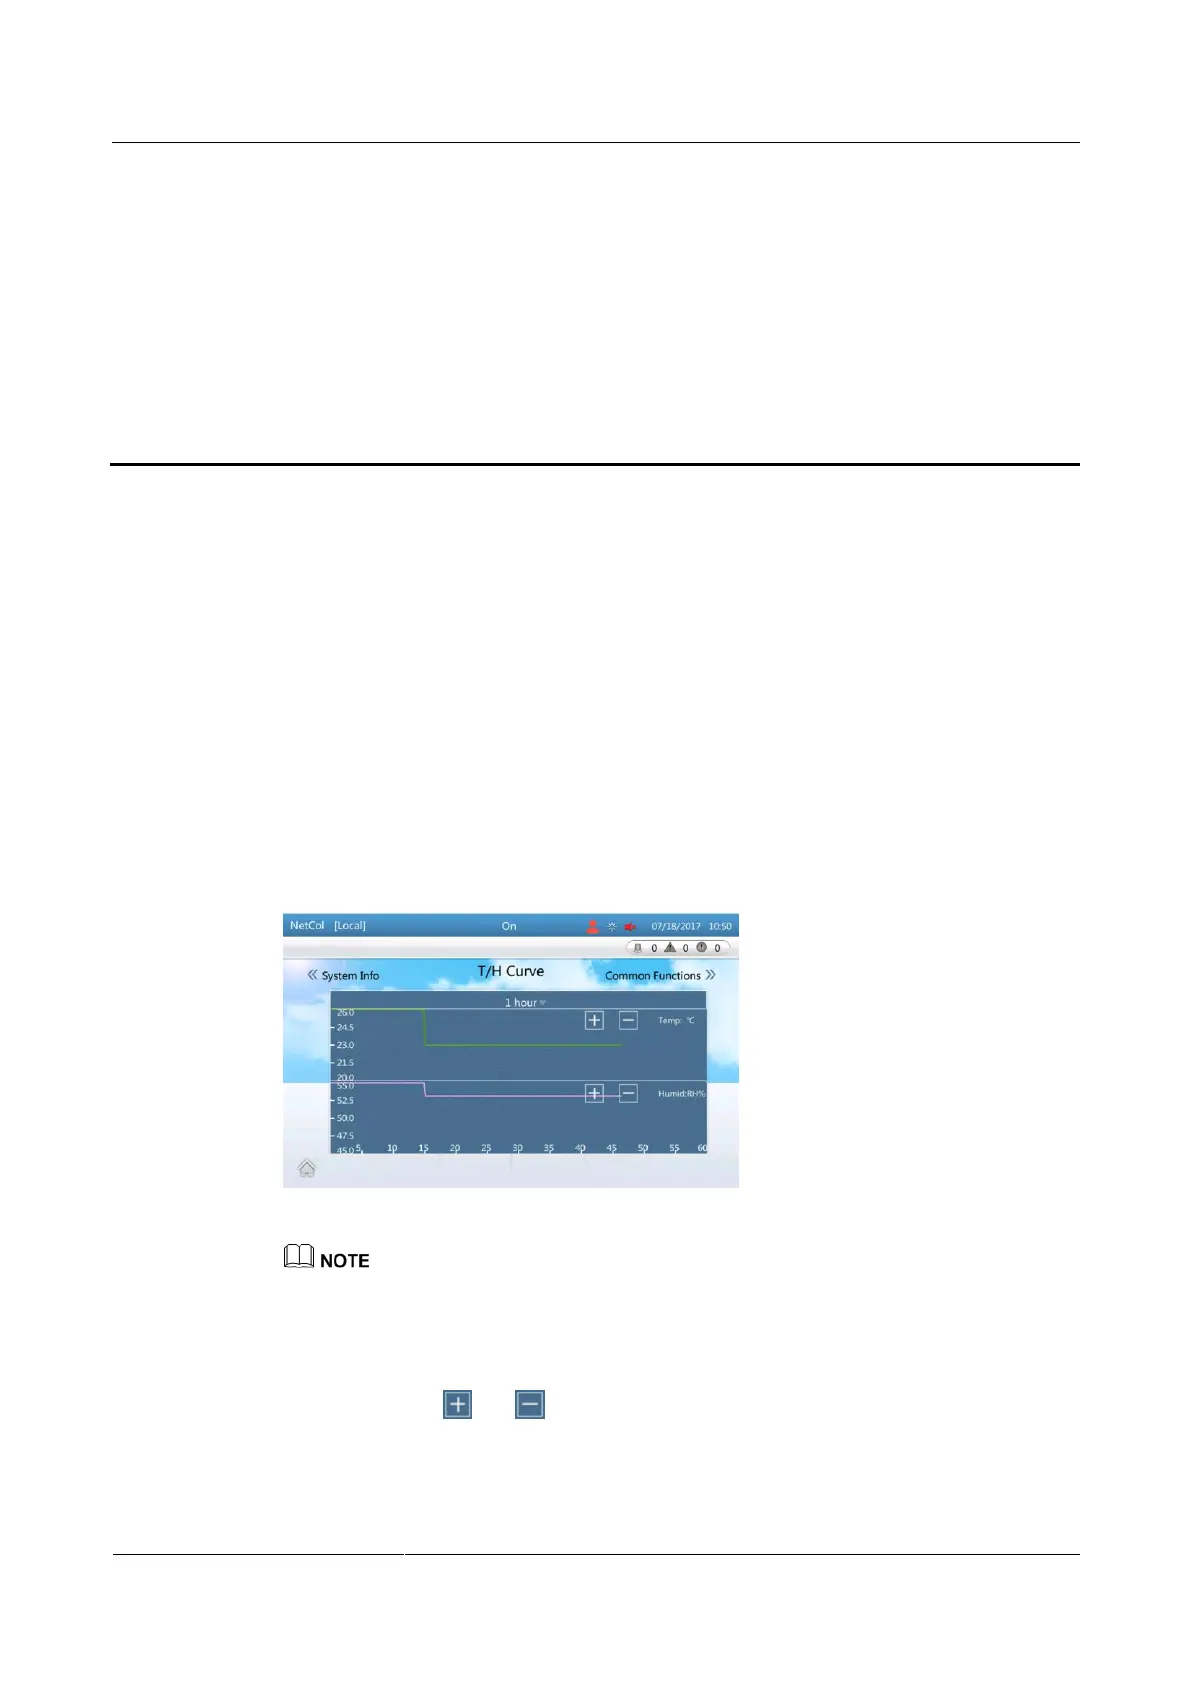
Step 1 On the home screen, tap T/H Curve. Figure 6-1 is displayed.
Figure 6-1 T/H curve screen
The temperature curve (upper) and the humidity curve (lower) are displayed on the same screen. The
abscissa shows time. The temperature set point is the midpoint temperature on the upper ordinate
while the humidity set point is the midpoint humidity on the lower ordinate.
The temperature and humidity curves show the current average temperature and humidity of the
control type.
You can tap and to zoom in or out the range of the temperature and humidity ordinate.
The midpoint temperature is the temperature set point and the midpoint humidity is the humidity set
point after the ordinate range is zoomed in or out.
You can view the temperatures from (temp set point - 3°C) to (temp set point + 3°C) at least and
from (temp set point - 30°C) to (temp set point + 30°C) at most.