The following is an example of the information that you will see on the display
panel. This example shows the layout of the information in the main menu when
the debug feature is enabled.
When you navigate through the hierarchy of the menu options on the LCD
operating panel assembly, the display panel shows the information for that option
and the up and down arrows appear on the side of the display panel. When you
get to the bottom of the hierarchy of the menu options, only the up arrow will be
available. When you are at the top of the hierarchy of the menu options, only the
down arrow will be available.
For the errors submenu set, if only one error occurs, the LCD display panel will
display that error. If more than one error occurs, the LCD display panel displays
the number of errors that have occurred. If no errors occur, the no error menu will
be available for navigation.
To move within the menu options, use the Scroll up or Scroll down buttons, then
the Select button to enter a submenu set.
The LCD operating panel assembly displays the following types of information
about the server:
v IMM system error log (SEL)
Note: The Scroll Down button will only function for this menu option if errors
have occurred. A list of current errors reported by the system will be displayed.
To see the system error log (SEL) and get the complete list of errors, go to the
IMM web page ( see “Logging on to the web interface” on page 50).
v System VPD information:
– Machine type and serial number
– Universal Unique Identifier (UUID) string
v System firmware levels:
– UEFI code level
– IMM code level
– pDSA code level
v IMM network information:
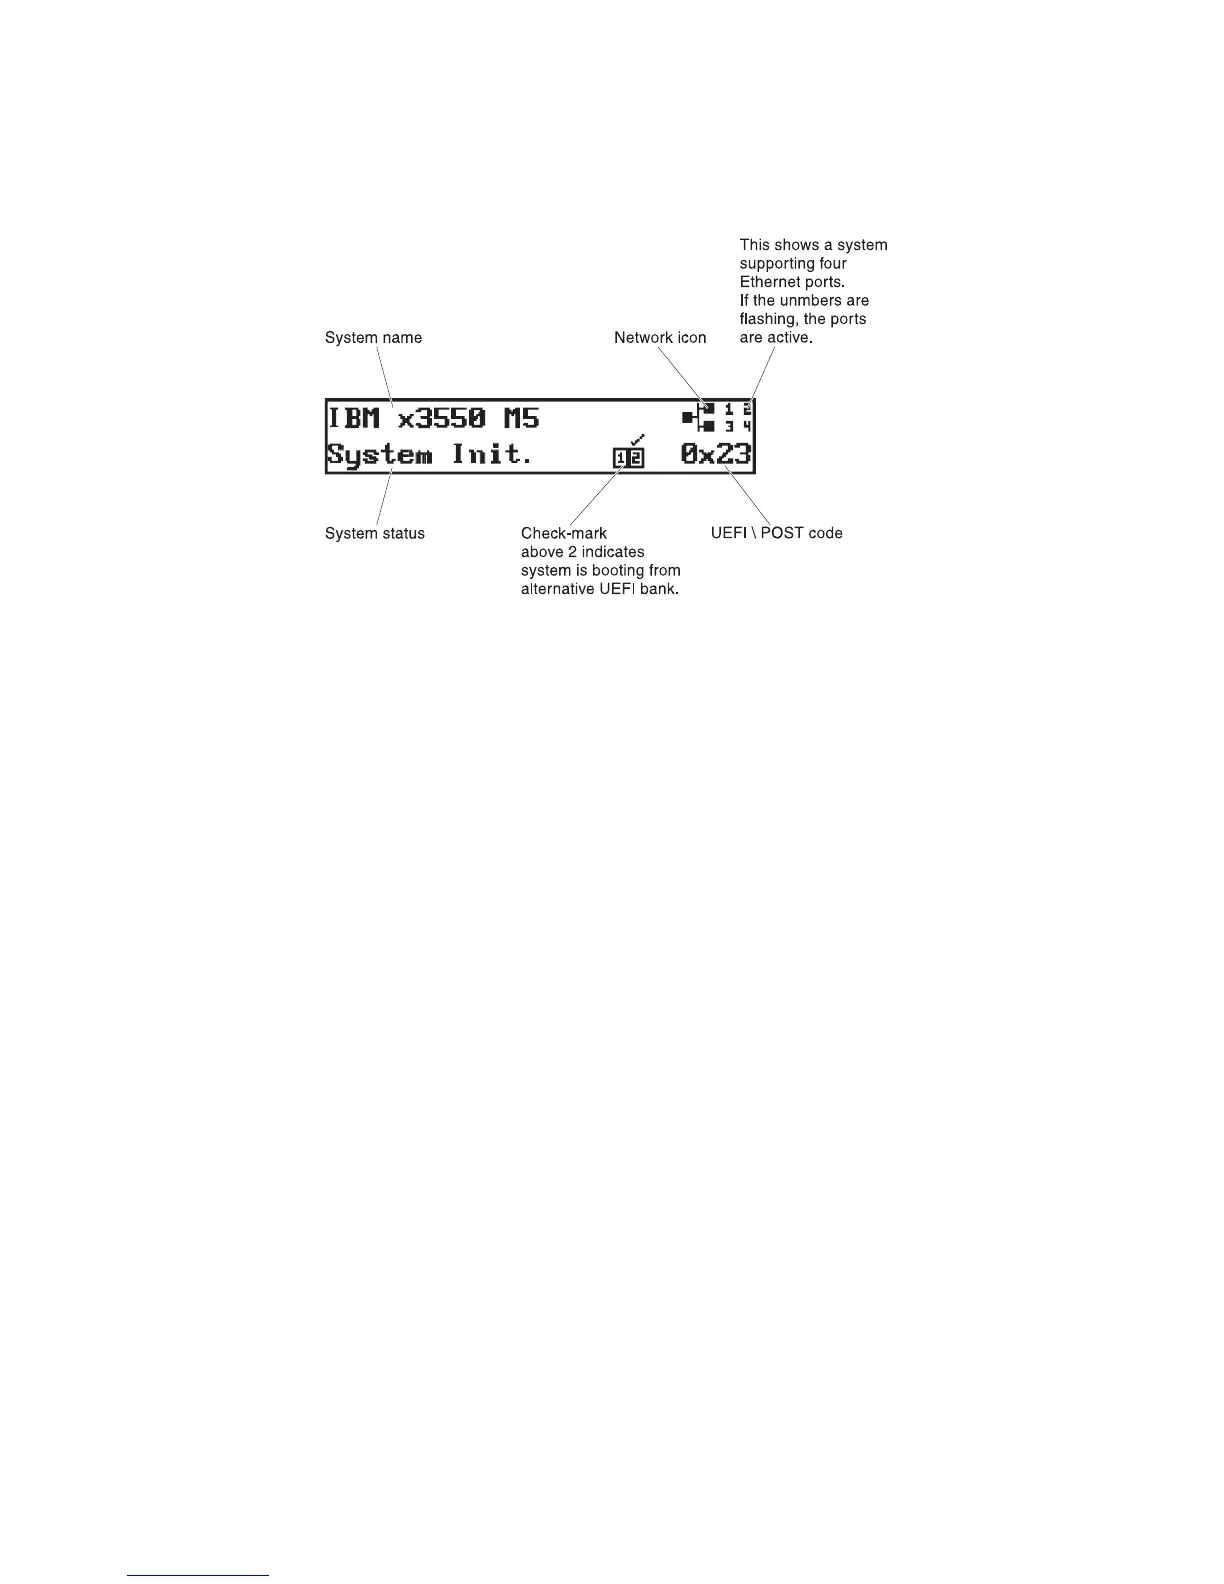
Figure 16. Main menu
22 IBM System x3550 M5 Type 5463: Installation and Service Guide
 Loading...