384 IBM eX5 Implementation Guide
Figure 8-14 Power Management as shown from the AMM
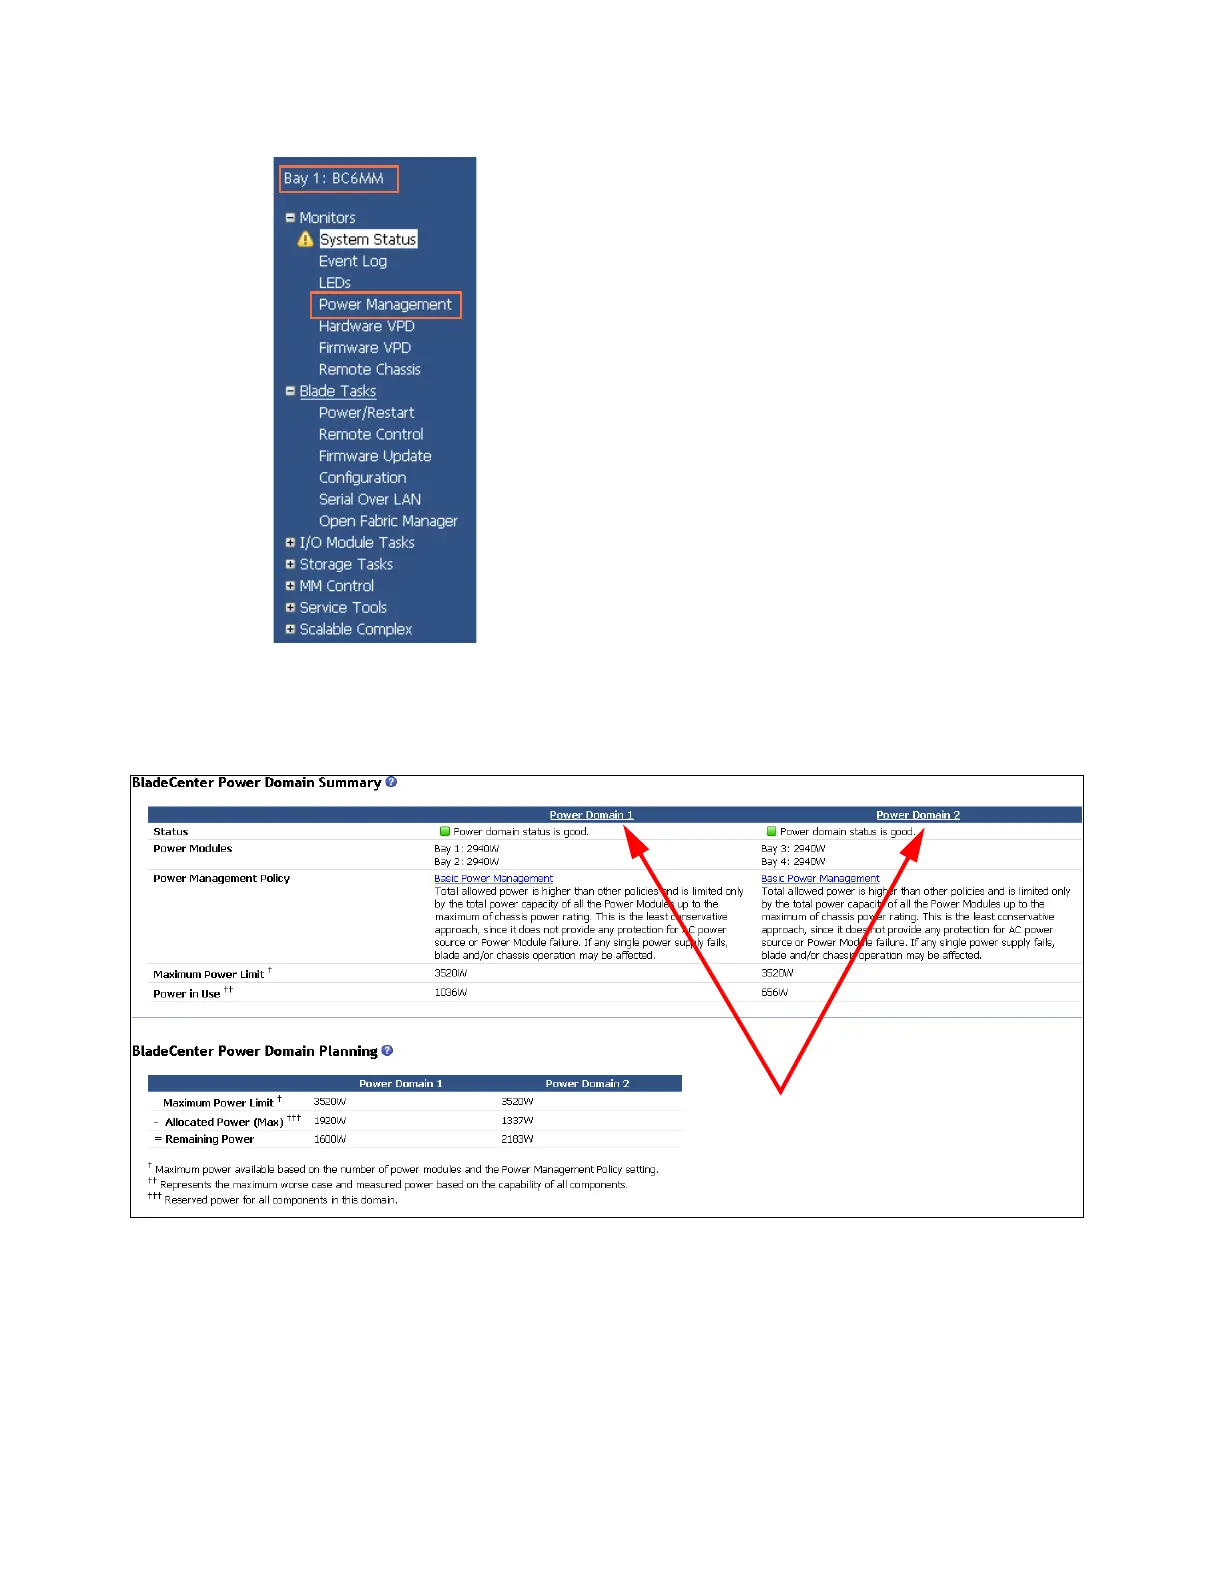
Figure 8-15 shows a breakdown of each domain and the current amount of power that is
currently being used for each domain.
Figure 8-15 Main view when looking at the AMM Power Management option on a BladeCenter H
You can see more details about the power consumption of each domain by clicking each
power domain heading, as shown in Figure 8-15. Figure 8-16 on page 385 shows an example
of the details that are displayed.
Click the headings
to see the detailed
power consumption
of each domain.
 Loading...