show system visibility jdm
Syntax show system visibility jdm
Release Information Command introduced in Junos OS Release 15.1X53-D40 for the NFX250 Network Services
Platform.
Description Display details such as uptime, number of tasks, CPU statistics, disk usage, disk I/O
statistics, memory usage, the list of network interfaces, and internal IP address for JDM
container.
Required Privilege
Level
view
Related
Documentation
show system visibility cpu on page 74•
• show system visibility host on page 77
• show system visibility jcp on page 82
• show system visibility memory on page 89
• show system visibility network on page 91
• show system visibility storage on page 94
• show system visibility vnf on page 97
List of Sample Output show system visibility jdm on page 87
Output Fields Table 14 on page 85 lists the output fields for the show system visibility jdm command.
Output fields are listed in the approximate order in which they appear.
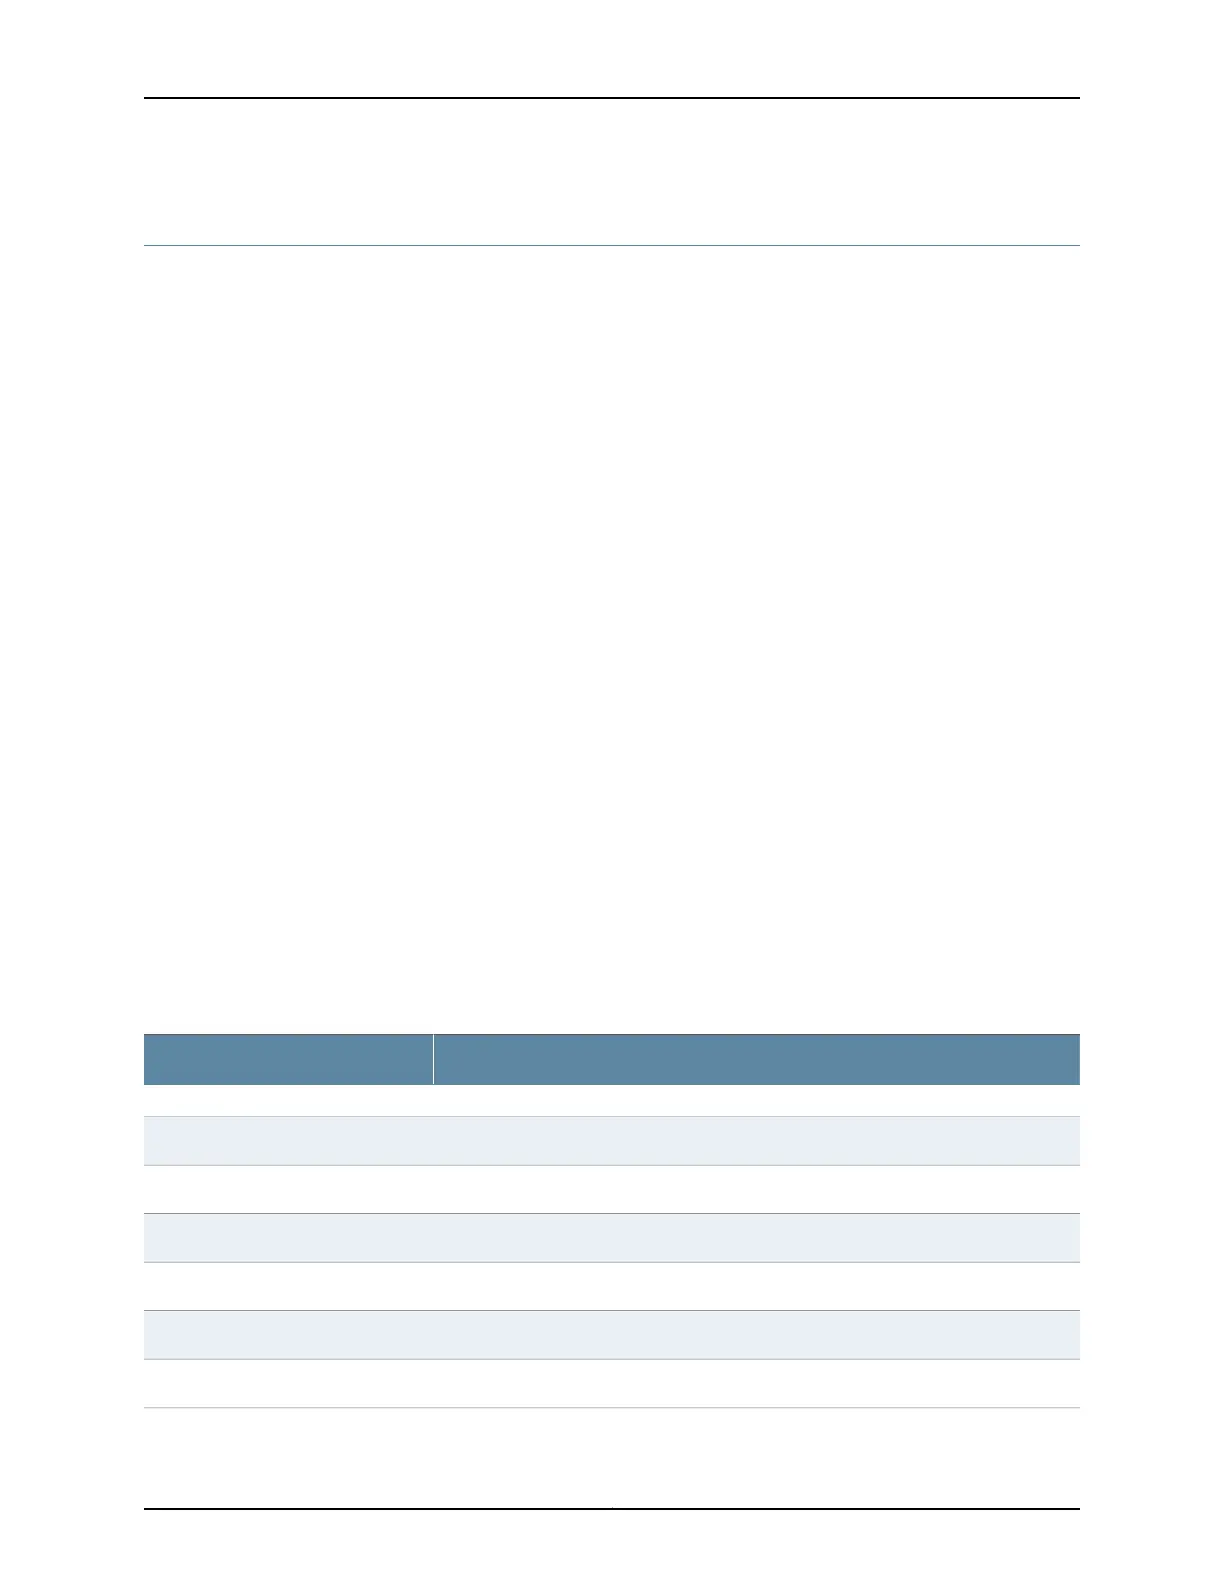
Table 14: show system visibility jdm Output Fields
Field DescriptionField Name
Fields for JDM CPU Statistics
The amount of user time, in seconds.User Time
The amount of system time, in seconds.System Time
The amount of time spent in idle mode, in seconds.Idle Time
The amount of time spent waiting for input/output (I/O) operations, in seconds.I/O Wait Time
The amount of spent nice time, in seconds.Nice Time
The amount of interrupt service time, in seconds.Interrupt Service Time
85Copyright © 2017, Juniper Networks, Inc.
Chapter 4: Management Configuration Statements and Operational Commands