139
3.18 Inter-Plate Consistency
Chapter 3
11
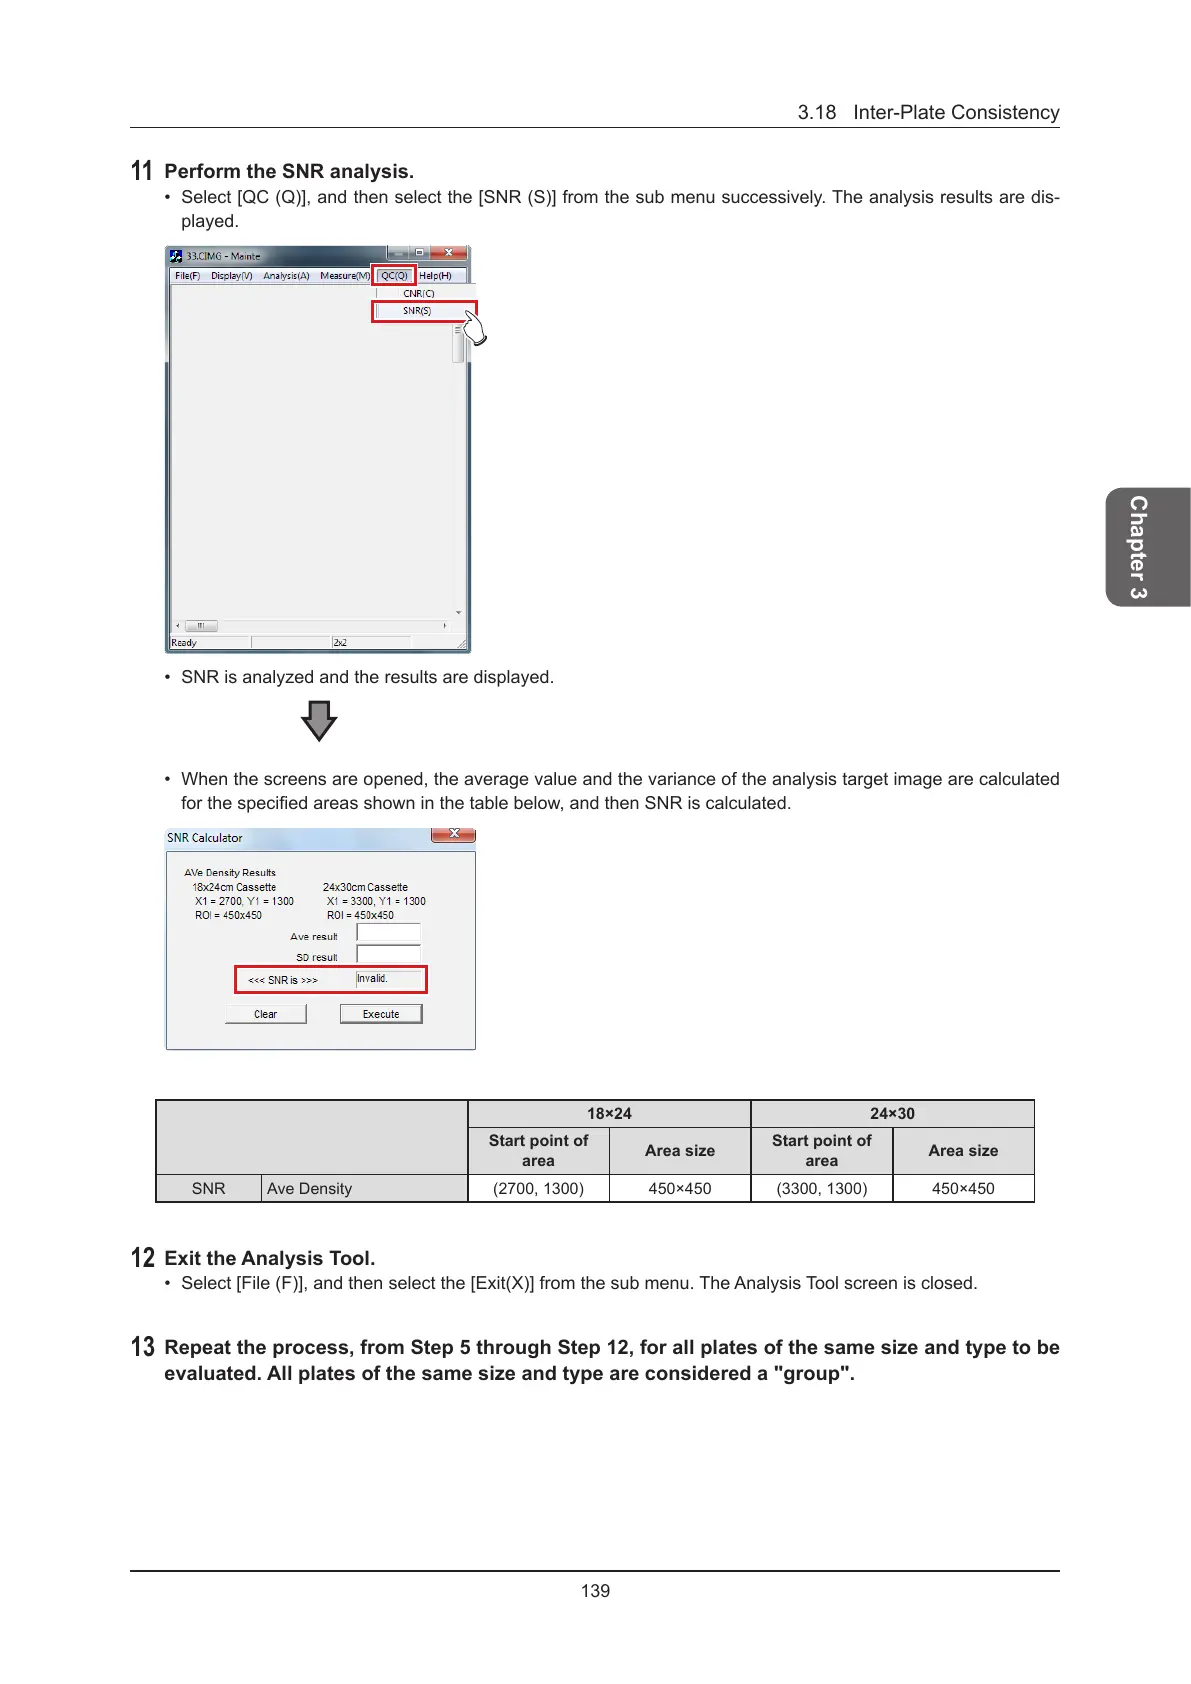
Perform the SNR analysis.
• Select [QC (Q)], and then select the [SNR (S)] from the sub menu successively. The analysis results are dis-
played.
• SNR is analyzed and the results are displayed.
• When the screens are opened, the average value and the variance of the analysis target image are calculated
for the specied areas shown in the table below, and then SNR is calculated.
18×24 24×30
Start point of
area
Area size
Start point of
area
Area size
SNR Ave Density (2700, 1300) 450×450 (3300, 1300) 450×450
12
Exit the Analysis Tool.
• Select [File (F)], and then select the [Exit(X)] from the sub menu. The Analysis Tool screen is closed.
13
Repeat the process, from Step 5 through Step 12, for all plates of the same size and type to be
evaluated. All plates of the same size and type are considered a "group".
 Loading...