38
2.6 Contrast to Noise Ratio (CNR) Check
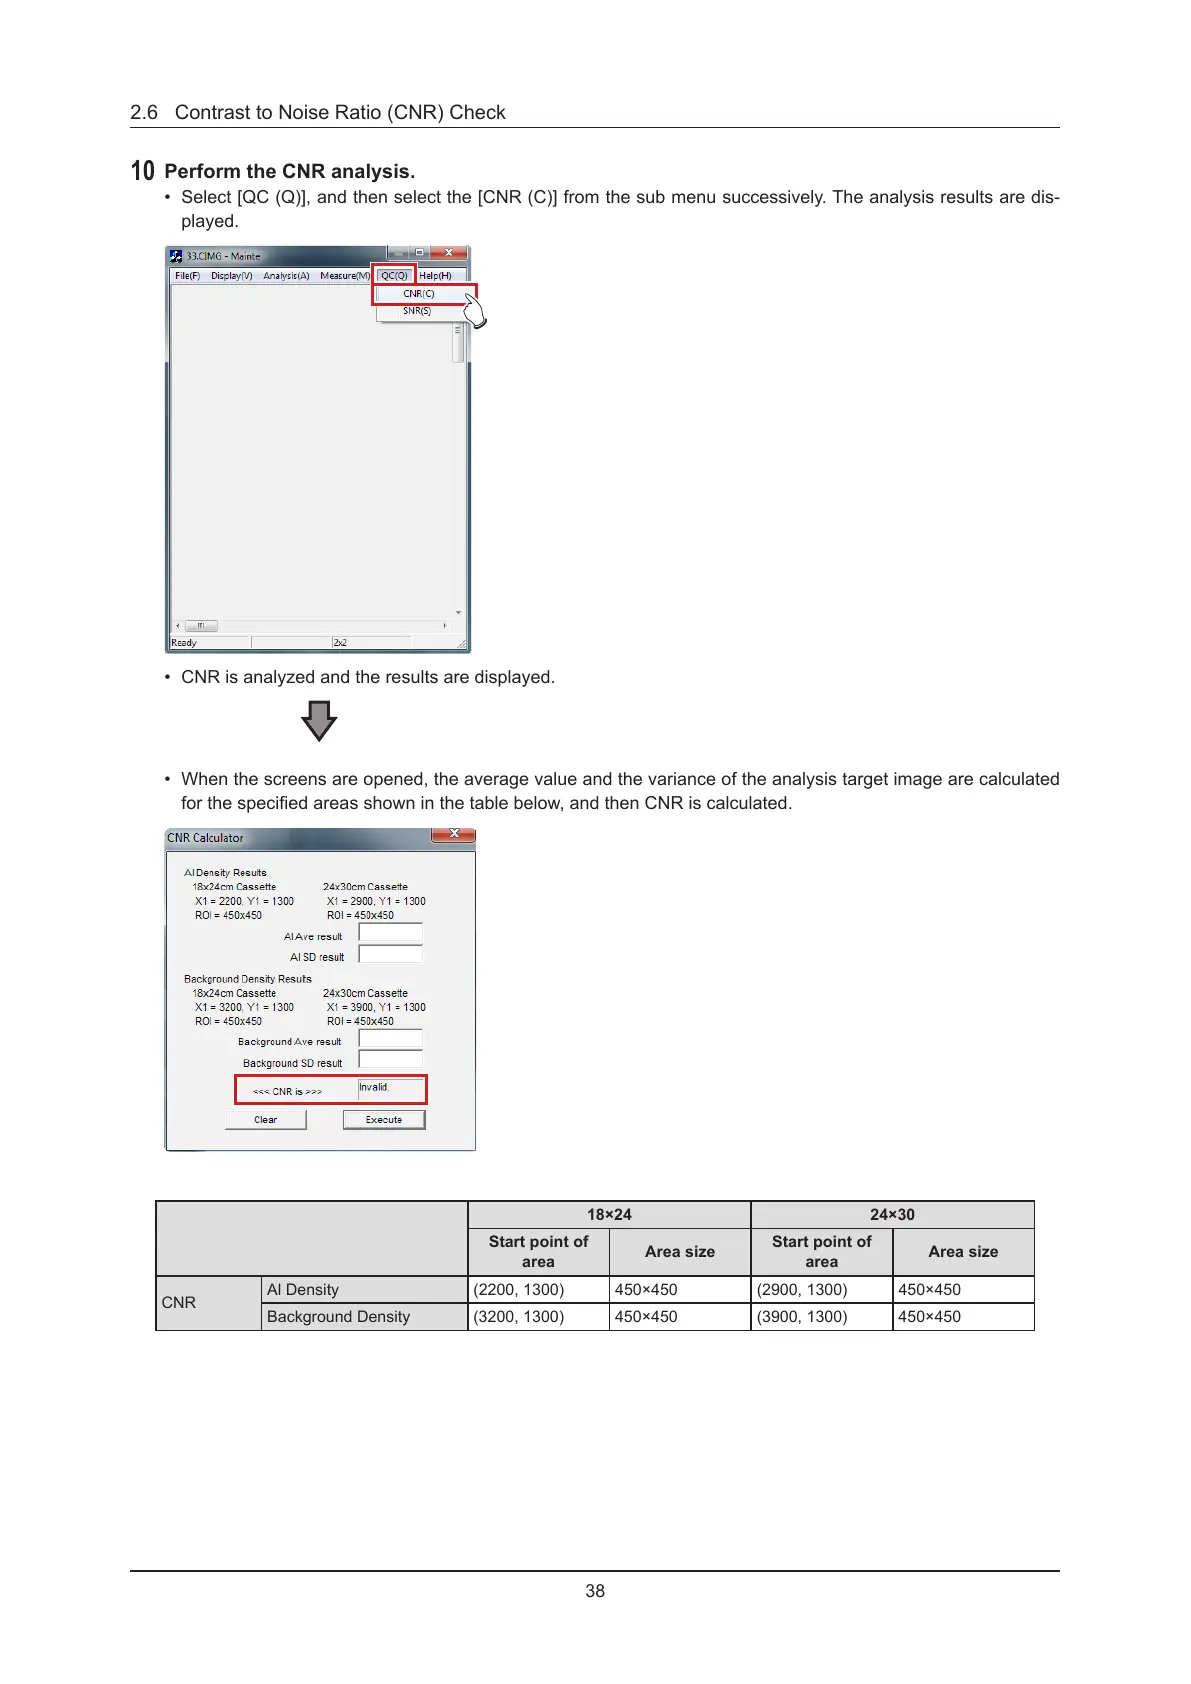
10
Perform the CNR analysis.
• Select [QC (Q)], and then select the [CNR (C)] from the sub menu successively. The analysis results are dis-
played.
• CNR is analyzed and the results are displayed.
• When the screens are opened, the average value and the variance of the analysis target image are calculated
for the specied areas shown in the table below, and then CNR is calculated.
18×24 24×30
Start point of
area
Area size
Start point of
area
Area size
CNR
Al Density (2200, 1300) 450×450 (2900, 1300) 450×450
Background Density (3200, 1300) 450×450 (3900, 1300) 450×450
 Loading...