FREQUENCY
Frequency range: DC to > 175 MHz.
Frequency resolution: 1 mHz to 50 MHz.
Nyquist frequency range: 25 mHz to 2.5 GHz.
Frequency scale factors; 5 mHz/div to 500 MHz/div in
1-2-5 sequence.
Frequency accuracy: 0.008% at center lobe.
Horizontal expansion: up to 100 times.
Cursors: Differential (arrows) and absolute (crosshair)
provide frequency and related amplitude measurements.
AMPLITUDE AND PHASE
General
Amplitude accuracy: see window functions table below.
Signal overflow: A warning indication is provided at
the top of the 9400A display when the input signal
exceeds the ADC range.
DC suppression: selected via the menu (ON/OFF),
removes DC component prior to FFT execution.
Cursors: Horizontal bars provide differential amplitude
measurements.
Number of traces: Time domain and frequency
domain data can be displayed simultaneously (up to
4 traces).
Spectrum Display Formats and Scaling
Real spectrum, in V/div, zero base line at 0 div (center
of screen).
Imaginary spectrum in V/div, zero base line at 0 div.
Power spectrum in dBm.
Power spectral density in dBm.
Frequency Domain Averaging up to 200 spectra for
power, PSD or magnitude.
Log display applies to power and PSD spectra in
10, 5, 2 or 1 dB/div; 80 clB display range.
Markers at left edge of screen give absolute dBm
reference (0 dBm is 1 mW into 50 ~).
Phase
Phase range: + 180 degrees to - 180 degrees.
Phase accuracy: ___ 5 degrees.
Phase scale factor: 50 degrees/div.
Zero base line: 0 div (center of screen).
Calibrated Vertical Expansion
All spectra formats, up to 10 times, in 1-2-5 sequence.
Window Functions
Selected in menu: Rectangular, von Hann (Hanning),
Hamming, Flattop, Blackman-Harris and user
definable. The table below gives filter pass band
shape and resolution:
FILTER PASS BAND AND RESOLUTION
Window
type
Rec-
tangular
von Hann
Hamming
Flattop
Blackman.
Harris
Filter band.
width at Highest
Scallop Noise band-
6dB side lobe Loss width
(freq. bins) (dB)
(dB at bin) (freq. bins)
1.21
--13 3.92 1.0
2.00 --32
1.42 1.5
1.81
--43 1.78 1.36
1.78 --44 0.01
2.96
1.81 --67
1.13 1.71
Definitions
Filter bandwidth at -6dB characterizes the frequency
resolution of the filter.
Highest side lobe indicates the reduction in leakage
of signal components into neighboring frequency bins.
Scallop loss gives amplitude accuracy of the
magnitude spectrum.
Noise bandwidth is the bandwidth of an equivalent
rectangular filter.
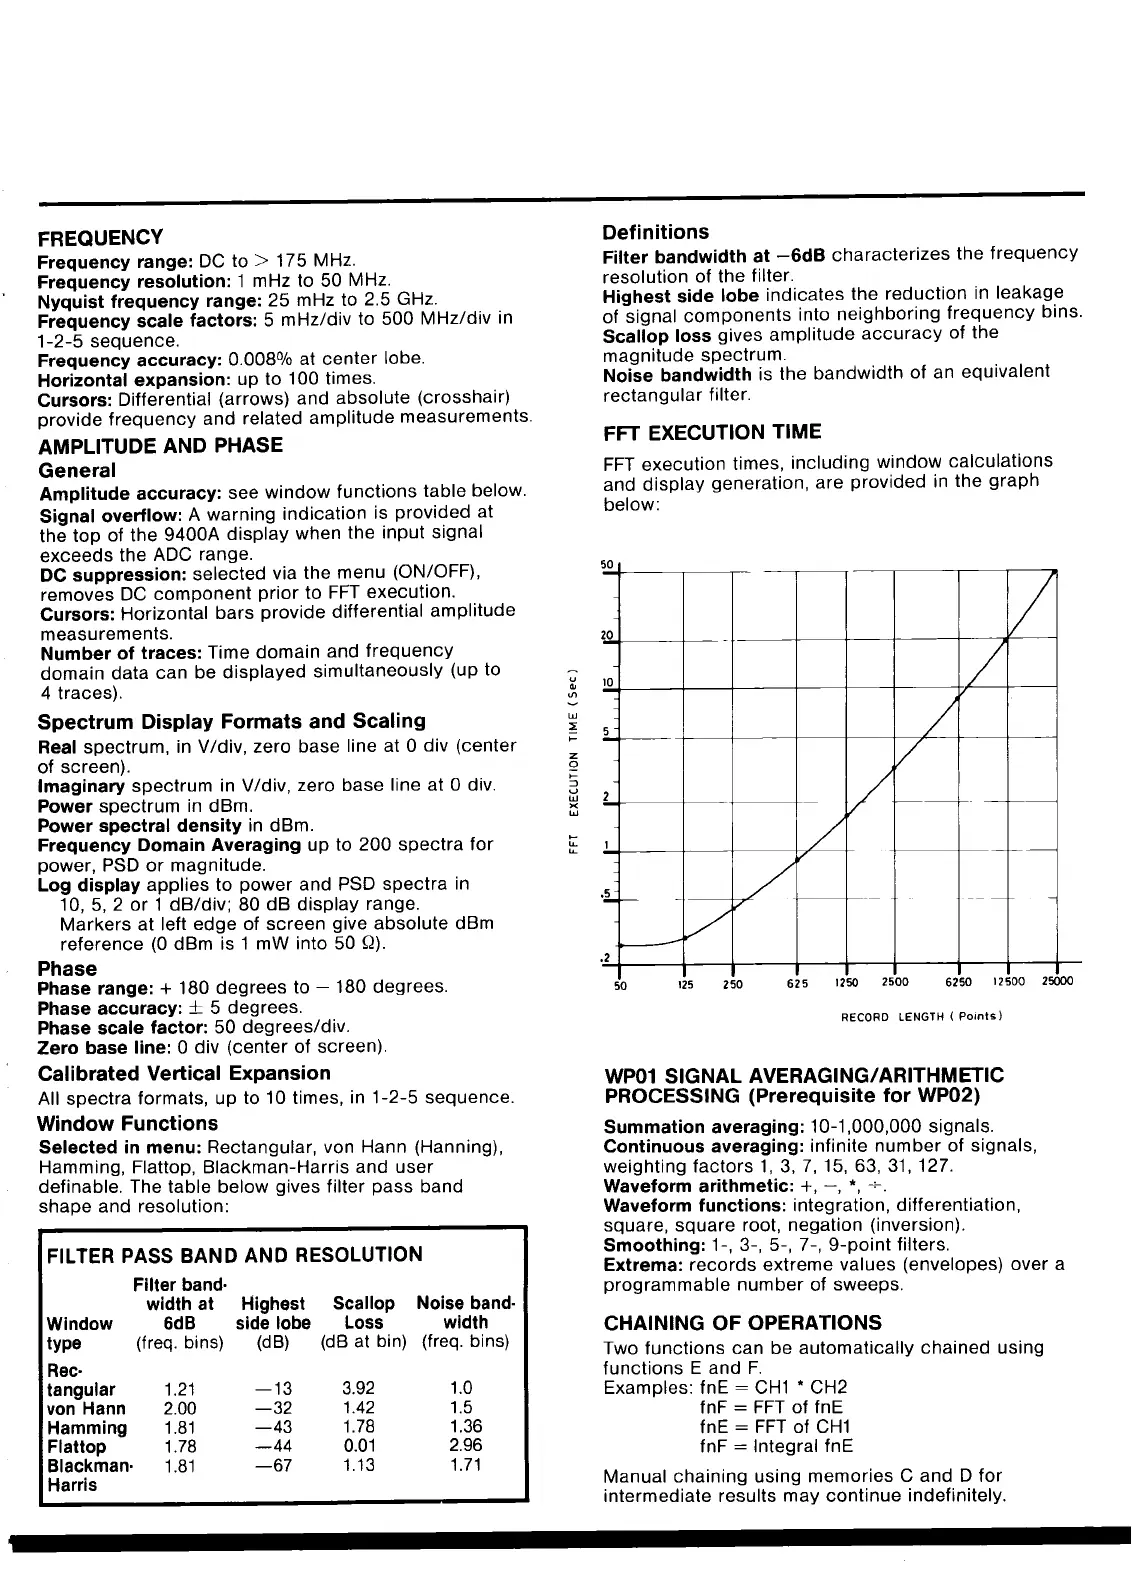
FFT EXECUTION TIME
FFT execution times, including window calculations
and display generation, are provided in the graph
below:
/
/
/
/
/
/
jJ
m
z.c
,_0
u_
v
LU
5-
X
L~
50
125 250 625
1250 2500 6250
12500 25000
RECORD LENGTH (Points)
WP01 SIGNAL AVERAGING/ARITHMETIC
PROCESSING (Prerequisite for WP02)
Summation averaging: 10-1,000,000 signals.
Continuous averaging: infinite number of signals,
weighting factors 1, 3, 7, 15, 63, 31,127.
Waveform arithmetic: +, -, *, +.
Waveform functions: integration, differentiation,
square, square root, negation (inversion).
Smoothing: 1-, 3-, 5-, 7-, 9-point filters.
Extrema: records extreme values (envelopes) over
programmable number of sweeps.
CHAINING OF OPERATIONS
Two functions can be automatically chained using
functions E and F.
Examples: fnE = CH1 * CH2
fnF = FFT of fnE
fnE = FFT of CH1
fnF = Integral fnE
Manual chaining using memories C and D for
intermediate results may continue indefinitely.