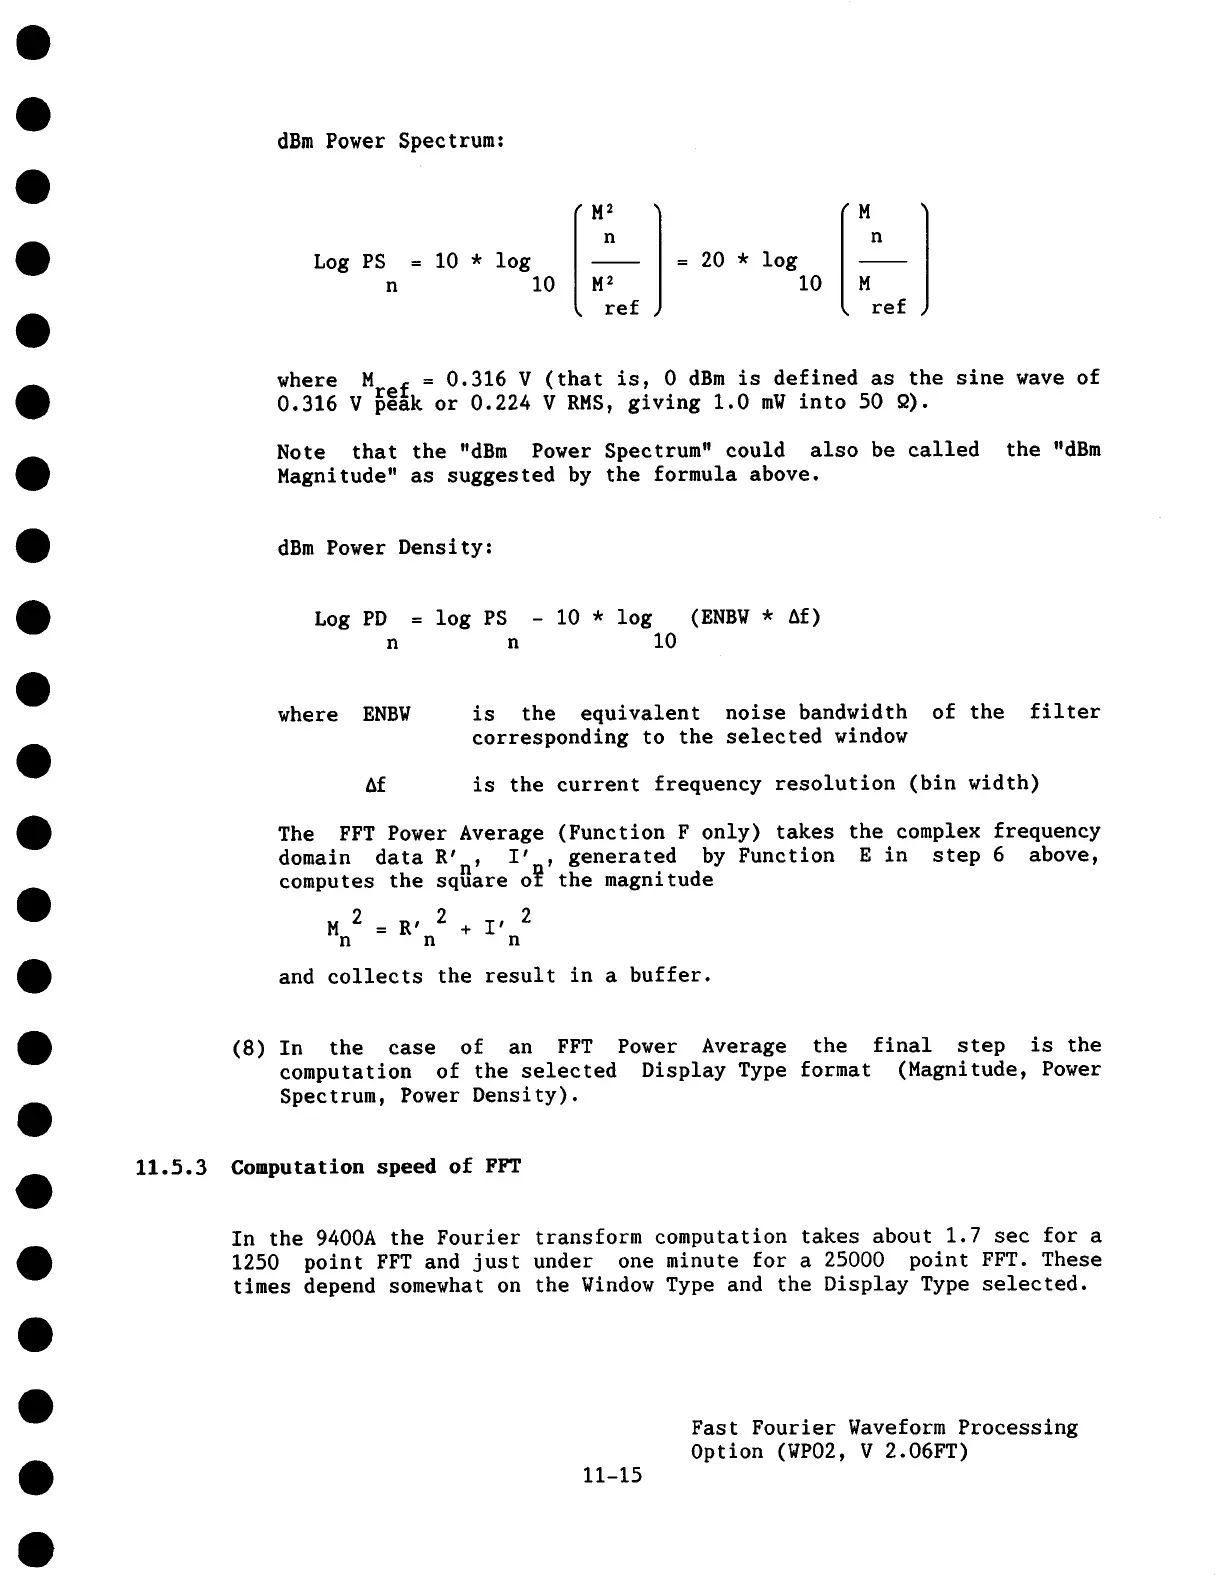
dBm Power Spectrum:
Log PS = 10 * log
n
10
M
2
n
ref
= 20 * log
I0
M
n
M
ref
where M r = 0.316 V (that is, 0 dBm is defined as the sine wave of
0.316 V ~k or 0.224 V RMS, giving 1.0 mW into 50 9).
Note that the "dBm Power Spectrum" could also be called the "dBm
Magnitude" as suggested by the formula above.
dBm Power Density:
Log PD = log PS - I0 * log (ENBW * Af)
n n I0
where ENBW
is the equivalent noise bandwidth of the filter
corresponding to the selected window
Af is the current frequency resolution (bin width)
The FFT Power Average (Function F only) takes the complex frequency
domain data R’
n,
I’ , generated by Function E in step 6 above,
computes the square o~ the magnitude
M2=R, 2+i
,
2
n n n
and collects the result in a buffer.
(8)
In the case of an FFT Power Average the final step is the
computation of the selected Display Type format (Magnitude, Power
Spectrum, Power Density).
11.5.3 Computation speed of FFT
In the 9400A the Fourier transform computation takes about 1.7 sec for a
1250 point FFT and just under one minute for a 25000 point FFT. These
times depend somewhat on the Window Type and the Display Type selected.
11-15
Fast Fourier Waveform Processing
Option (WP02, V 2.06FT)
 Loading...
