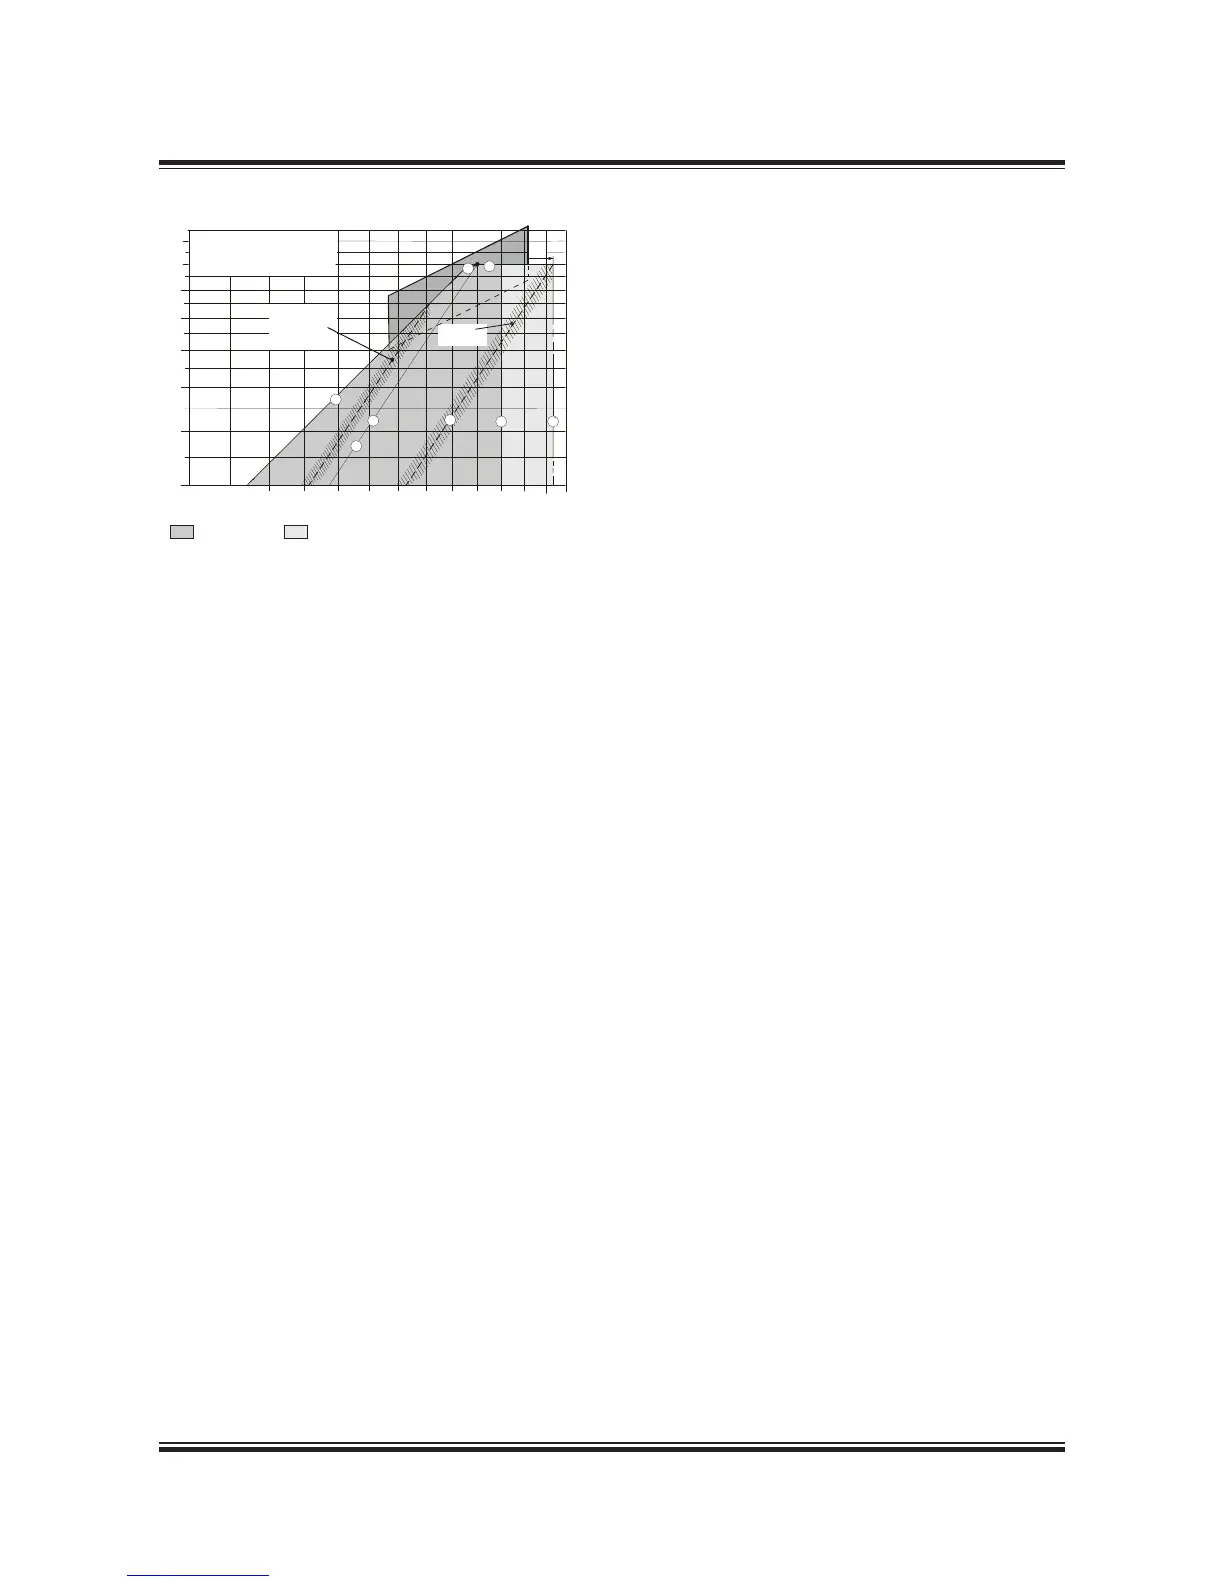
Line 1: Propeller curve through optimising point (O)
layout curve for engine
Line 2: Heavy propeller curve
fouled hull and heavy seas
Line 3: Speed limit
Line 3’: Extended speed limit, provided torsional vibration
conditions permit
Line 4: Torque/speed limit
Line 5: Mean effective pressure limit
Line 6: Increased light running propeller curve
clean hull and calm weather
layout curve for propeller
Line 7: Power limit for continuous running
178 60 94-2.0
Fig. 2.04.03: Extended load diagram for speed derated
engine with increased light running
Examples of the use of the Load Diagram
In the following, some examples are illustrating
the flexibility of the layout and load diagrams.
• Example 1 shows how to place the load dia-
gram for an engine without a shaft generator
coupled to a fixed pitch propeller.
• Example 2 comprises diagrams for the same
configuration, here with the optimising point on
the left of the heavy running propeller curve (2),
providing an extra engine margin for heavy run-
ning, similar to the case in Fig. 2.04.03.
• Example 3 shows the same layout for an engine
with a fixed pitch propeller (Example 1), but with
a shaft generator.
• Example 4 is a special case of example 3, where
the specified MCR is placed near the top of the
layout diagram.
In this case, the shaft generator is cut off, and
the gensets used when the engine runs at spec-
ified MCR. This makes it possible to choose a
smaller engine with a lower power output.
• Example 5 shows diagrams for an engine cou-
pled to a controllable pitch propeller, with or
without a shaft generator, (constant speed or
combinator curve operation).
For a specific project, the layout diagram for the
actual project shown later in this chapter may be
used for drawing of the actual load diagram.
 Loading...