62 63
Press twice to return to the main screen.
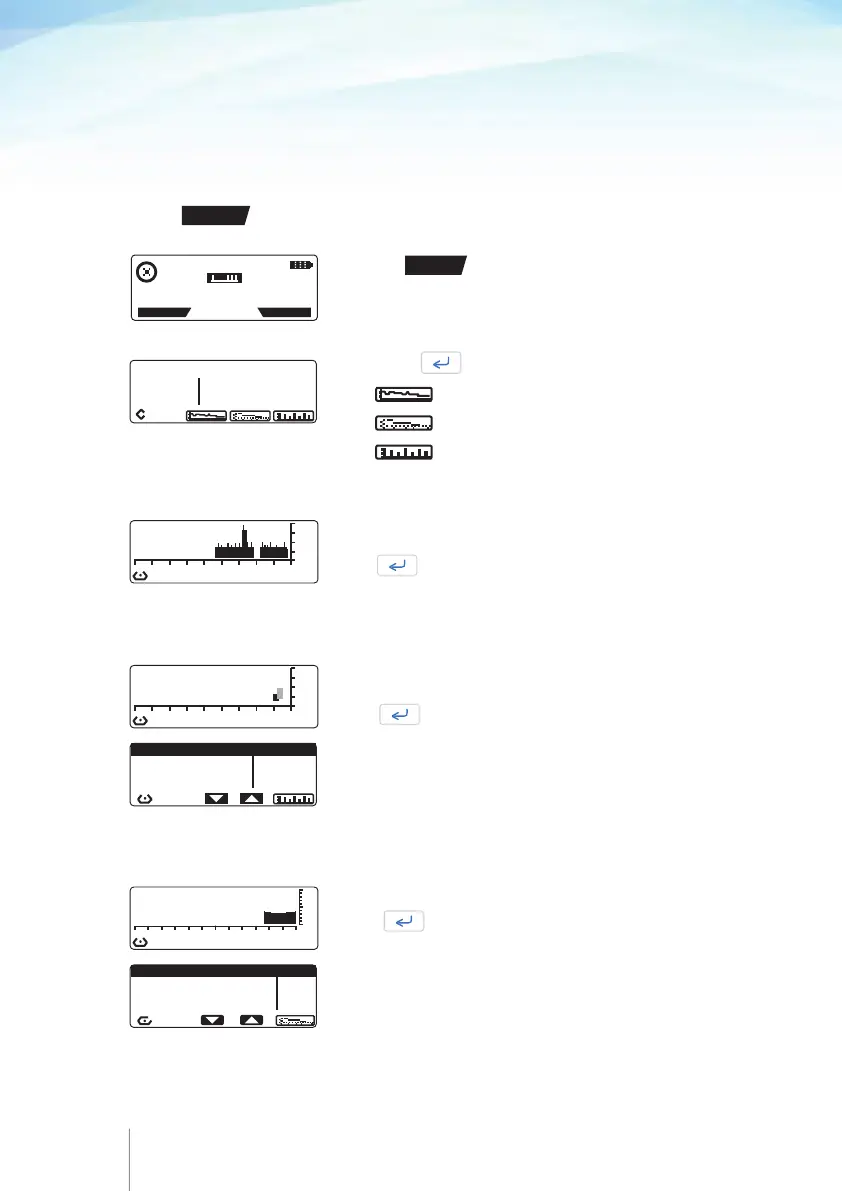
Press to view the graph of the infusion.
Press to view the graph of the pain.
Press to view the graph of bolus.
The graph shows the infused volume curves over the last
9 hrs.
Press to return to the History screen.
The graphs shows the patient bolus demanded/delivered and
the clinician bolus over the last 9 hrs.
Press to see the bolus list.
In the bolus list patient bolus demanded/delivered, Auto-
bolus started/given, loading dose and clinician bolus
are included. Also, the date and the time of each event is
displayed.
The graph shows the pain level over the last 24 hrs.
Press to see the pain level list.
SINCE: 5 NOV 2011 11: 22
INFUSED BOLUS
97.0 ml DEMAND : 7
GIVEN : 5
Infusion graph
Bolus graph and bolus list
Pain level graph and pain list
0
-8 -6 -4 -2 0
LAST 9 hr INFUSION
ml
0
-2 0 -16 -12 -8 -4 0
LAST 24 hr PAIN LEV.
DATE / PAIN SCORE
11 MAR 2012 11 : 10 3
11 MAR 2012 10 : 10 7
11 MAR 2012 09 : 10 10
6
0
LAST 9 hr BOLU
B
O
L
U
S
BOLUS / TIME/ DAY
BOLUS START 20 : 42/1
BOLUS DEMAND 20 : 39/1
LOADING DOSE 20 : 39/1
7.4 Viewing infusion graphs during running / pump
on hold
Infusion graphs are accessible either during infusion or when the pump is on hold.
Press
HISTORY
key at any time to review patient bolus demand, patient bolus given
and infused volume.
Press the
HISTORY
key to review the current infusion
progress.
11 APR 2014 11:45
PUMP RUNNING
HISTORY
PROTOCOL