5-24 Mx100/200 Series Operation Manual
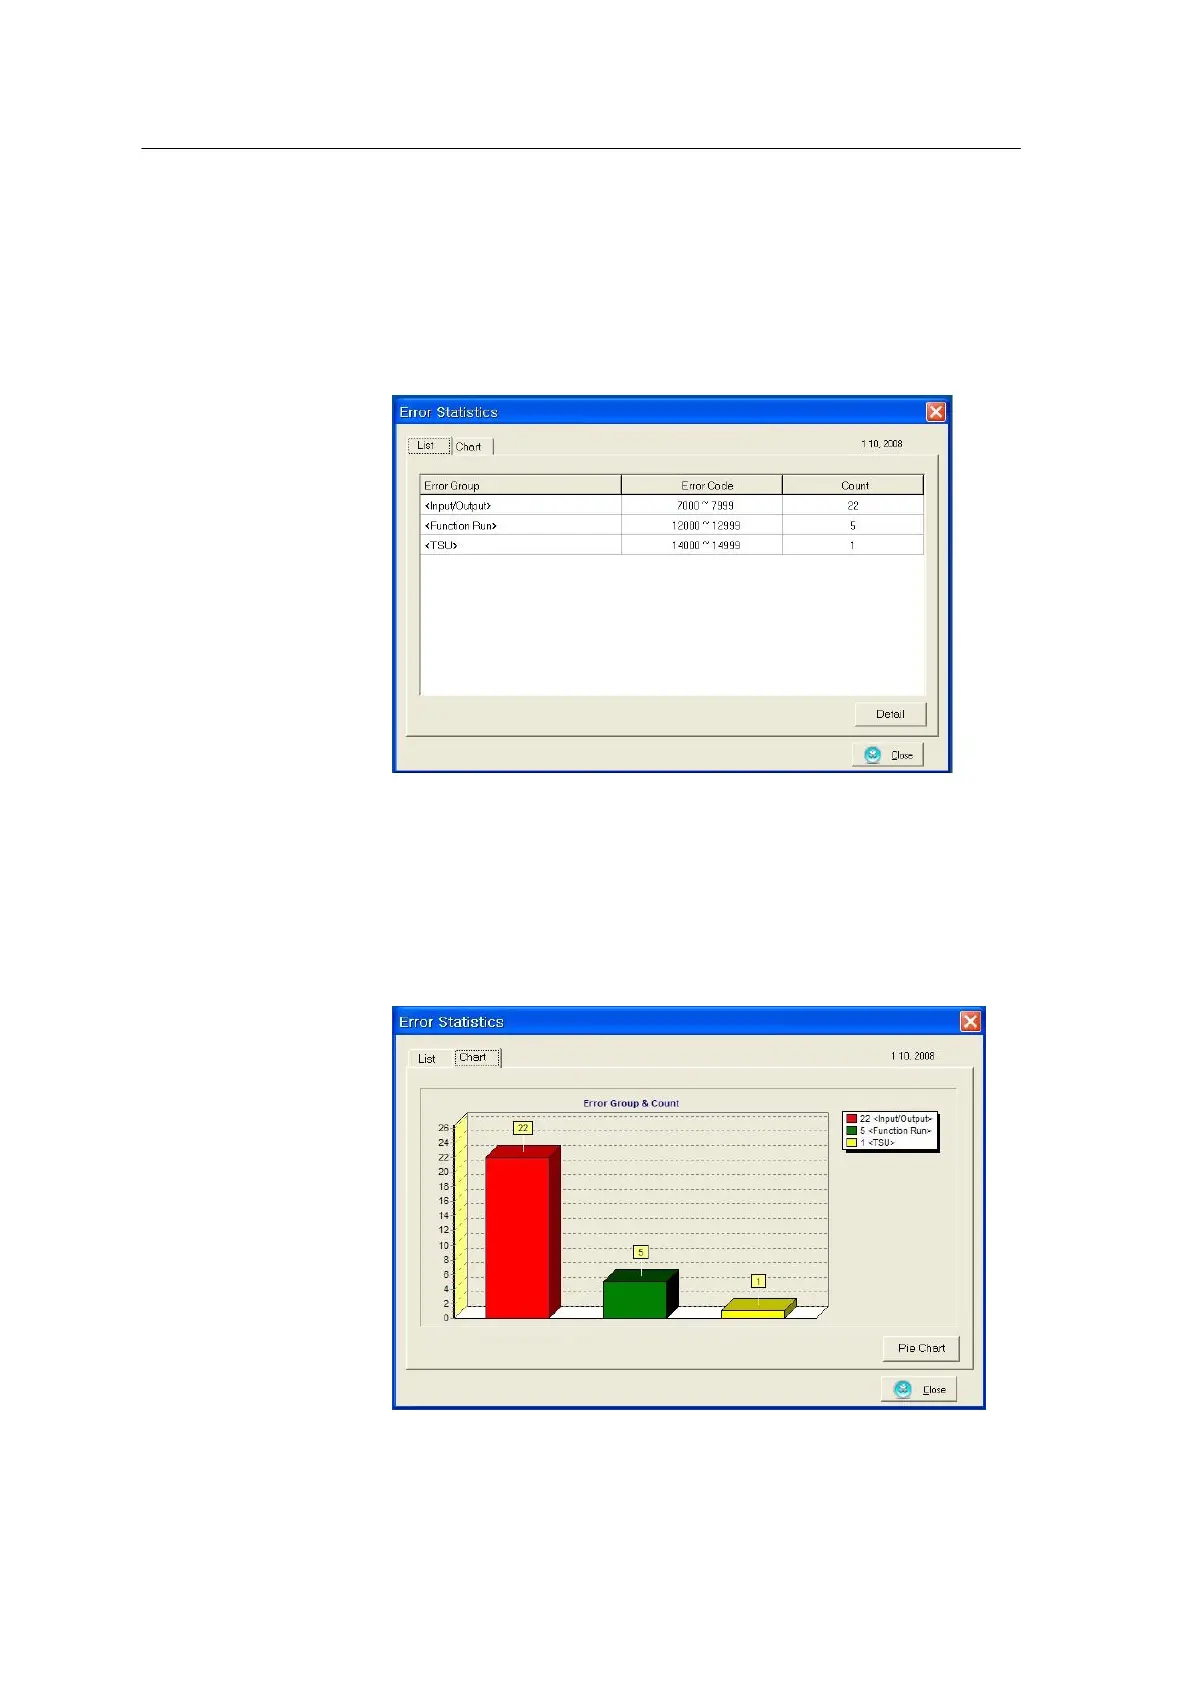
The following window appears when the Statistics button is pressed.
<Figure 3-17 가 Error Statistics-List>
Error count by error code is displayed when the Detail button is pressed.
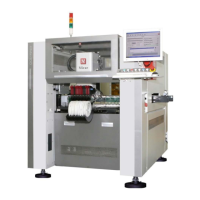
The Chart tab is used to display error count in bar graph or pie graph. The figure below shows
error code and count in bar graph.
<Figure 3-18 가 Error Statistics-Chart>
Press the Close button to close the error statistics window and return to the HWIF main window.