4 Operation and Basic Settings
48 IDA-3106 Narda
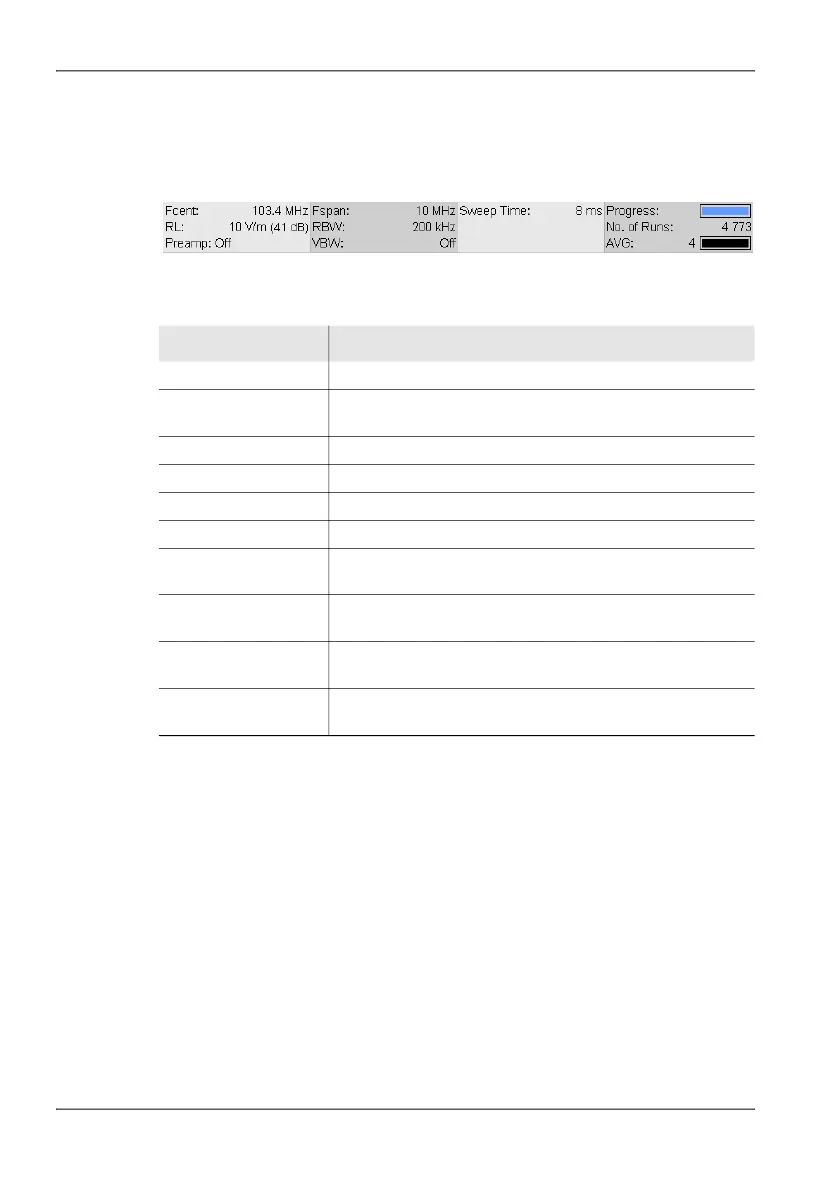
4.4.2 The lower status bar
The lower status bar gives information about the current measurement. The
contents of the display may vary, depending on the operating mode.
Figure 10: Lower status bar
Table 4: Lower status bar elements (example)
Element Description
Fcent Center frequency
RL Reference level (the input attenuator setting (0 – 50 dB) is
shown in brackets)
Preamp: On/Off Preamplifier in handle on / off
Fspan Displayed frequency span
RBW Resolution bandwidth
VBW Video bandwidth
Sweep Time/
Time Span
Time for each measurement cycle
Progress Progress of measurement (as a check until the first screen
display during measurements requiring a lot of processing)
No. of Runs Number of measurements
made since last measurement start
AVG Number of measurements
to form average or time to form average