NIRStar 14.1 - User Manual
Page 35 of 124
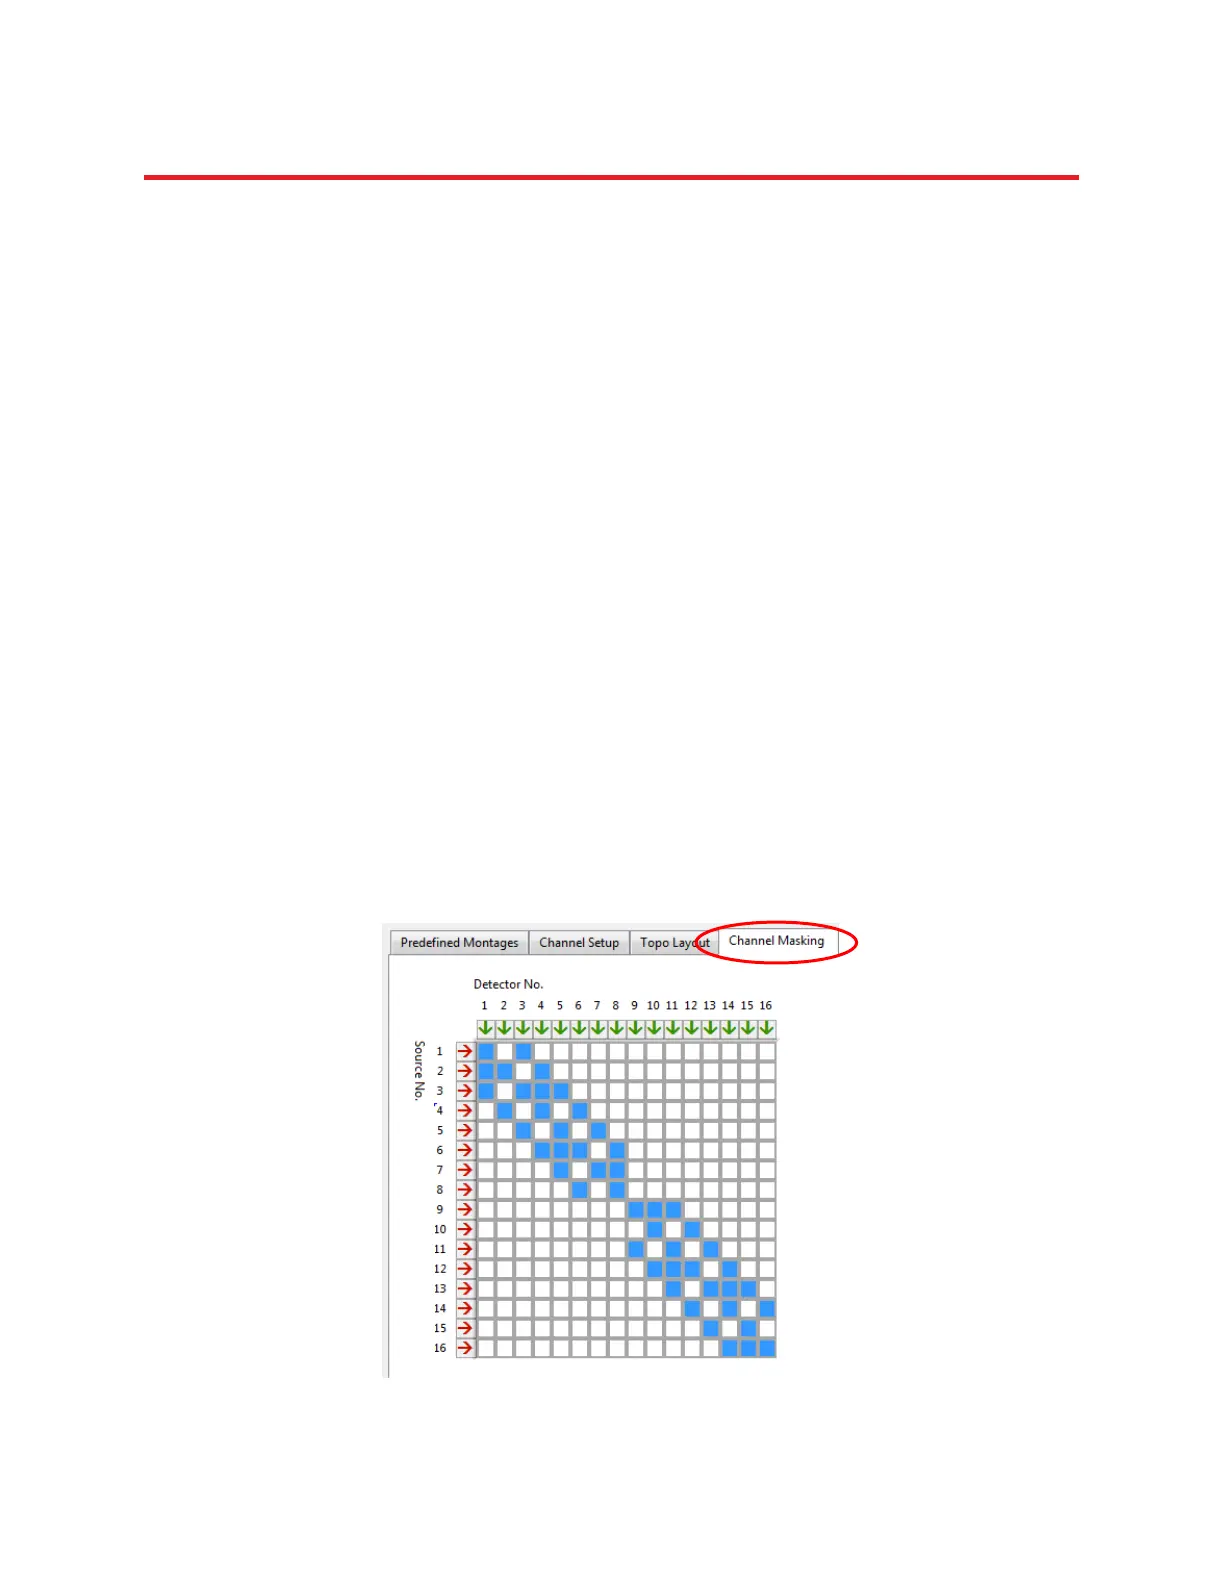
5.5 Channel Masking
The Channel Masking tab is used for selection of specific source-detector-combinations (i.e.,
measurement channels) for display in the time-series plots (see Section 10.1). Typically, these will be
channels that are expected to yield good data quality based on the sensor separation distance being less
than ~3.5 cm. Rows represent sources, and columns represent detectors. Selected channels are marked
by filled squares, and will appear in plots. Unchecked (white) boxes mark those channels which are
excluded from plots. (This is the reason why no time series are displayed if the Channel masking matrix is
empty, as indicated in Section 5.4.)
When a Topo Layout is specified (see Section 5.4), each measurement channel that the user includes is
automatically selected in the Channel Masking matrix, as these are assumed to be the channels of
interest. However, the user may modify the Channel Masking after the Topo Layout has been defined.
Figure 19 shows the Channel Masking pattern that corresponds to the Topo Layout example in Section
5.4.
The boxes marked with red rightward-pointing arrows are used to select/de-select complete rows (i.e.,
all detectors for a specific source). The boxes marked with green downward-pointing arrows are used to
select/de-select complete columns (i.e., all sources for a specific detector).
The masking options also allow the user to select or clear all channels. Use the Apply Topo Layout button
in the Channel Masking tab to create a mask that displays all of the channels in the currently specified
topographic layout (see Section 5.4). The 'Auto' function masks out all channels that have a signal level,
in Volts, below the specified value (default = 0.1 V). To use this functionality, a gain calibration has to be
performed first.
Figure 19. Channel Masking: The pattern shown was automatically adopted from the Topo Layout (see Section
5.4)