NIRStar 14.1 - User Manual
Page 59 of 124
Trace Plot Display
The time series data of the estimated oxy- and deoxy-hemoglobin concentration changes for each
channel selected in the Channel Mask (see Section 5.5) are represented in a trace plot on the left side of
the Data Visualization tab (see Figure 41).
A variety of display features are available for optimizing the appearance of the trace and topographic
displays. Note that some of these tools are available only during the Preview or Record phase and are
grayed out otherwise.
Please note that all visualization tools, including the scale factor and the low-pass
filter, apply to the illustrated data and have no effect on the data that is saved for
offline analysis.
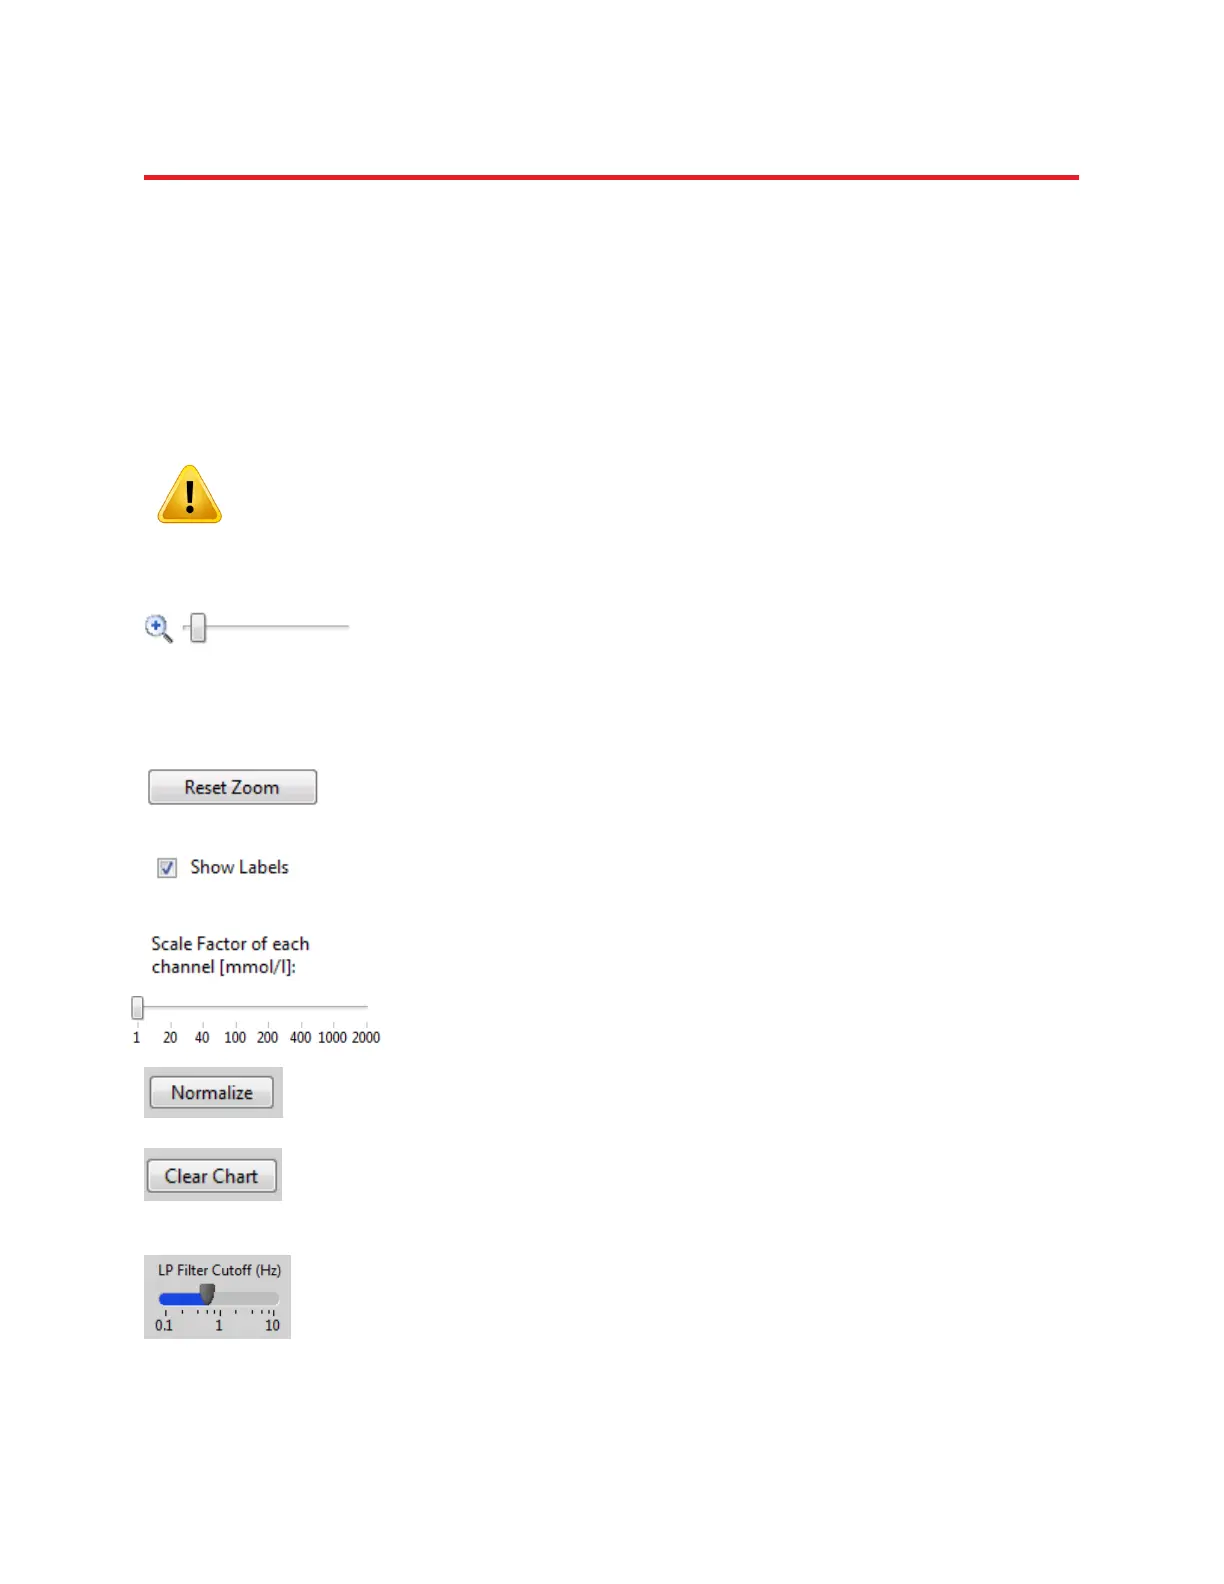
With the Zoom Tool, the user can select specific channels for viewing. Note
that zooming affects only the Channel Number axis (i.e., vertical zoom) and
not the time scale. Use the vertical scrollbar to the left of the time-series
graph to select a specific set of channels.
The Reset Zoom button returns the trace display to its default settings, in
which the first 20 channels selected in the Channel Mask (see Section 5.5)
are visible.
Checking the show labels box brings up a channel legend next to the trace
plot. After a scan, the user is also able to select which channels are to be
shown.
All channels can be scaled up (i.e., displayed amplitude of signal-level
fluctuations is increased) to increase visibility of data details. If no scale
factor (i.e., ‘1’) is applied, the unit of the Hb states is mmol/l. This can be
scaled up to a factor of 2000 mmol/l. After the recording session is
stopped, the chosen scale factor is applied to the entire data set.
Normalizes the data by recalculating the baseline for concentration
changes.
Clears the trace display for real-time visualization. After the user clicks on
the Stop button, the last time frames are displayed, and a scrollbar for
selecting the time interval of interest appears, below the trace display’s
time axis.
A moving-average low-pass filter is applied, whose cutoff frequency can be
set by adjusting the slider labeled LP Filter Cutoff (Hz). This feature may be
used to remove high-frequency noise and/or the heartbeat component
from the displayed signal. Figure 43 shows an example of a filtered data
display; the prominent cardiac frequency at around 1Hz is filtered out, by
selecting a cutoff frequency lower than the heart rate.