NIRStar 14.1 - User Manual
Page 58 of 124
10 Data Visualization and Recording
Following the proper System Setup steps, data may be previewed or recorded. The real-time data
visualization capability of the NIRStar 14.1 software in the Data Visualization tab is automatically
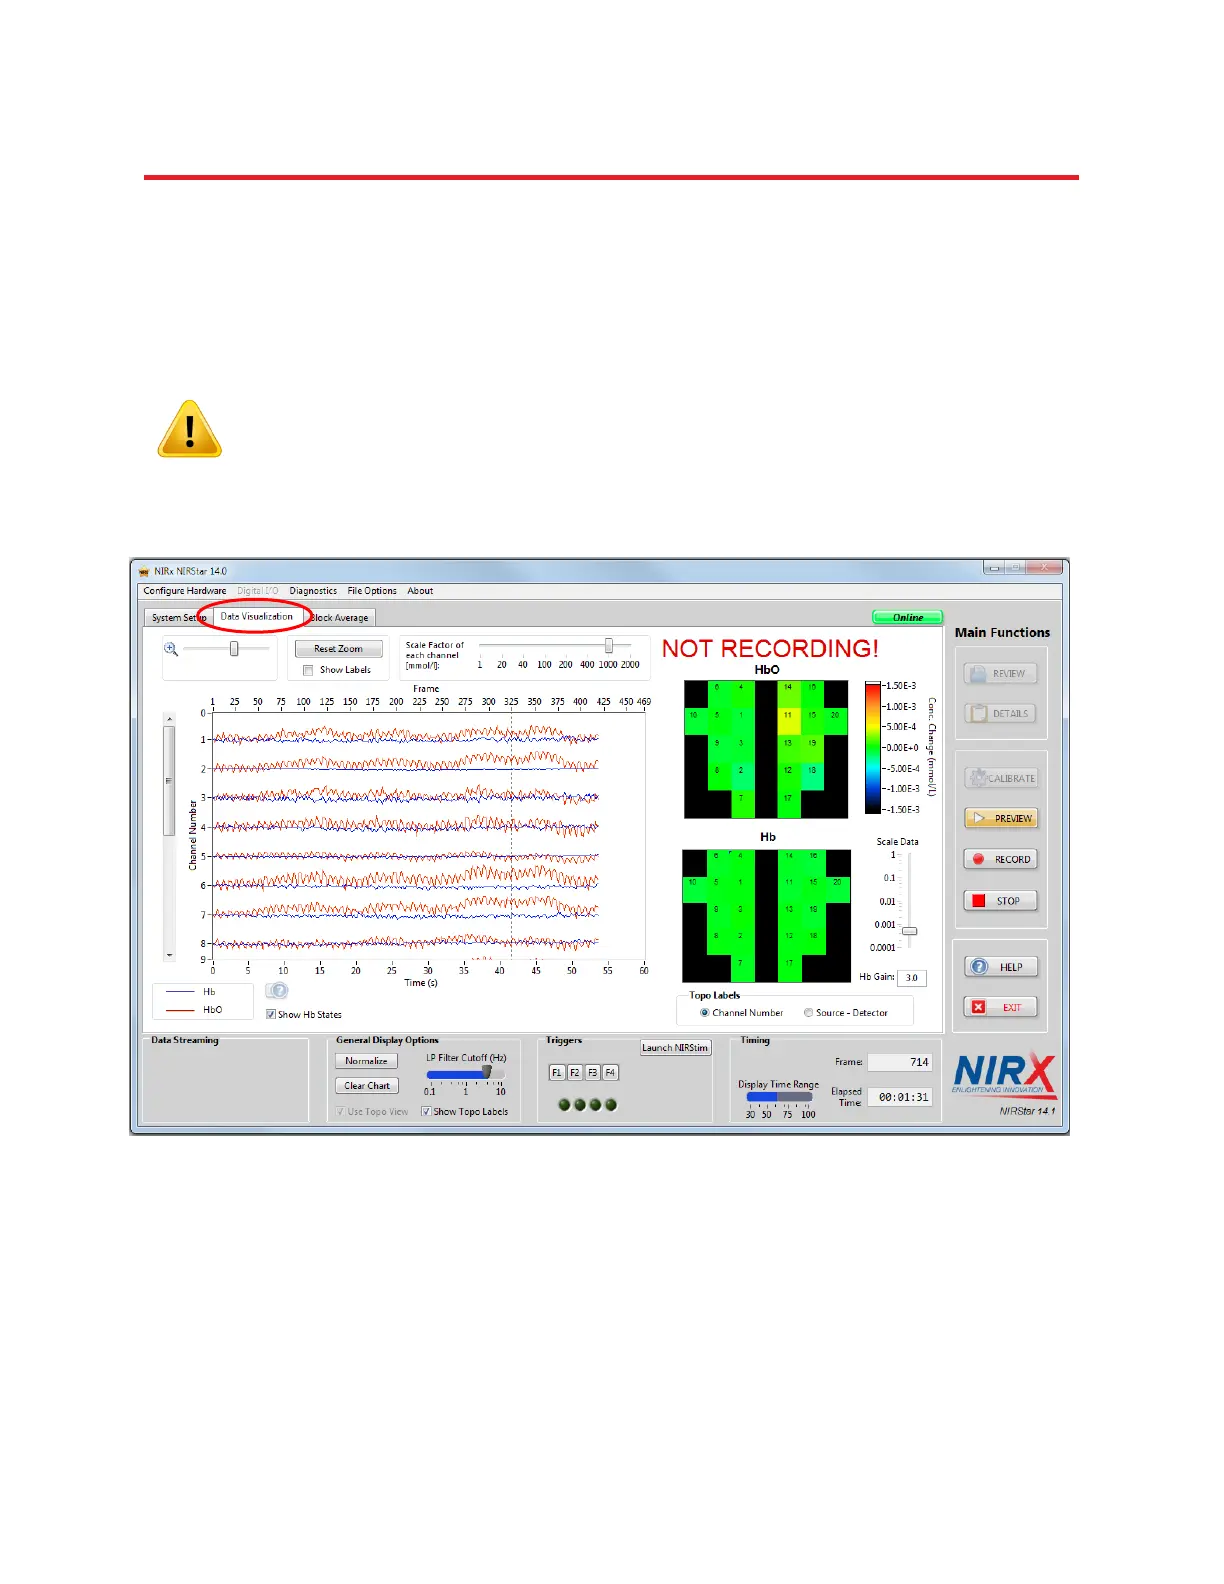
opened. Two basic ways of data display are presented side-by-side: A traces display, and topographic
maps.
Data in the Trace Display and in the Topographic Display are by default shown as
the estimated changes in oxy- and deoxy-hemoglobin concentrations. Please note
that the recorded data are the raw signals (voltages) at the individual measurement
wavelengths. These can be visualized by unchecking the ‘Show Hb States’ check
button.
10.1
Figure 41. Data Visualization tab showing the trace display (left side) and the topographic displays for Hb and
HbO changes (right side).