NIRStar 14.1 - User Manual
Page 91 of 124
17.1 Topographic Display
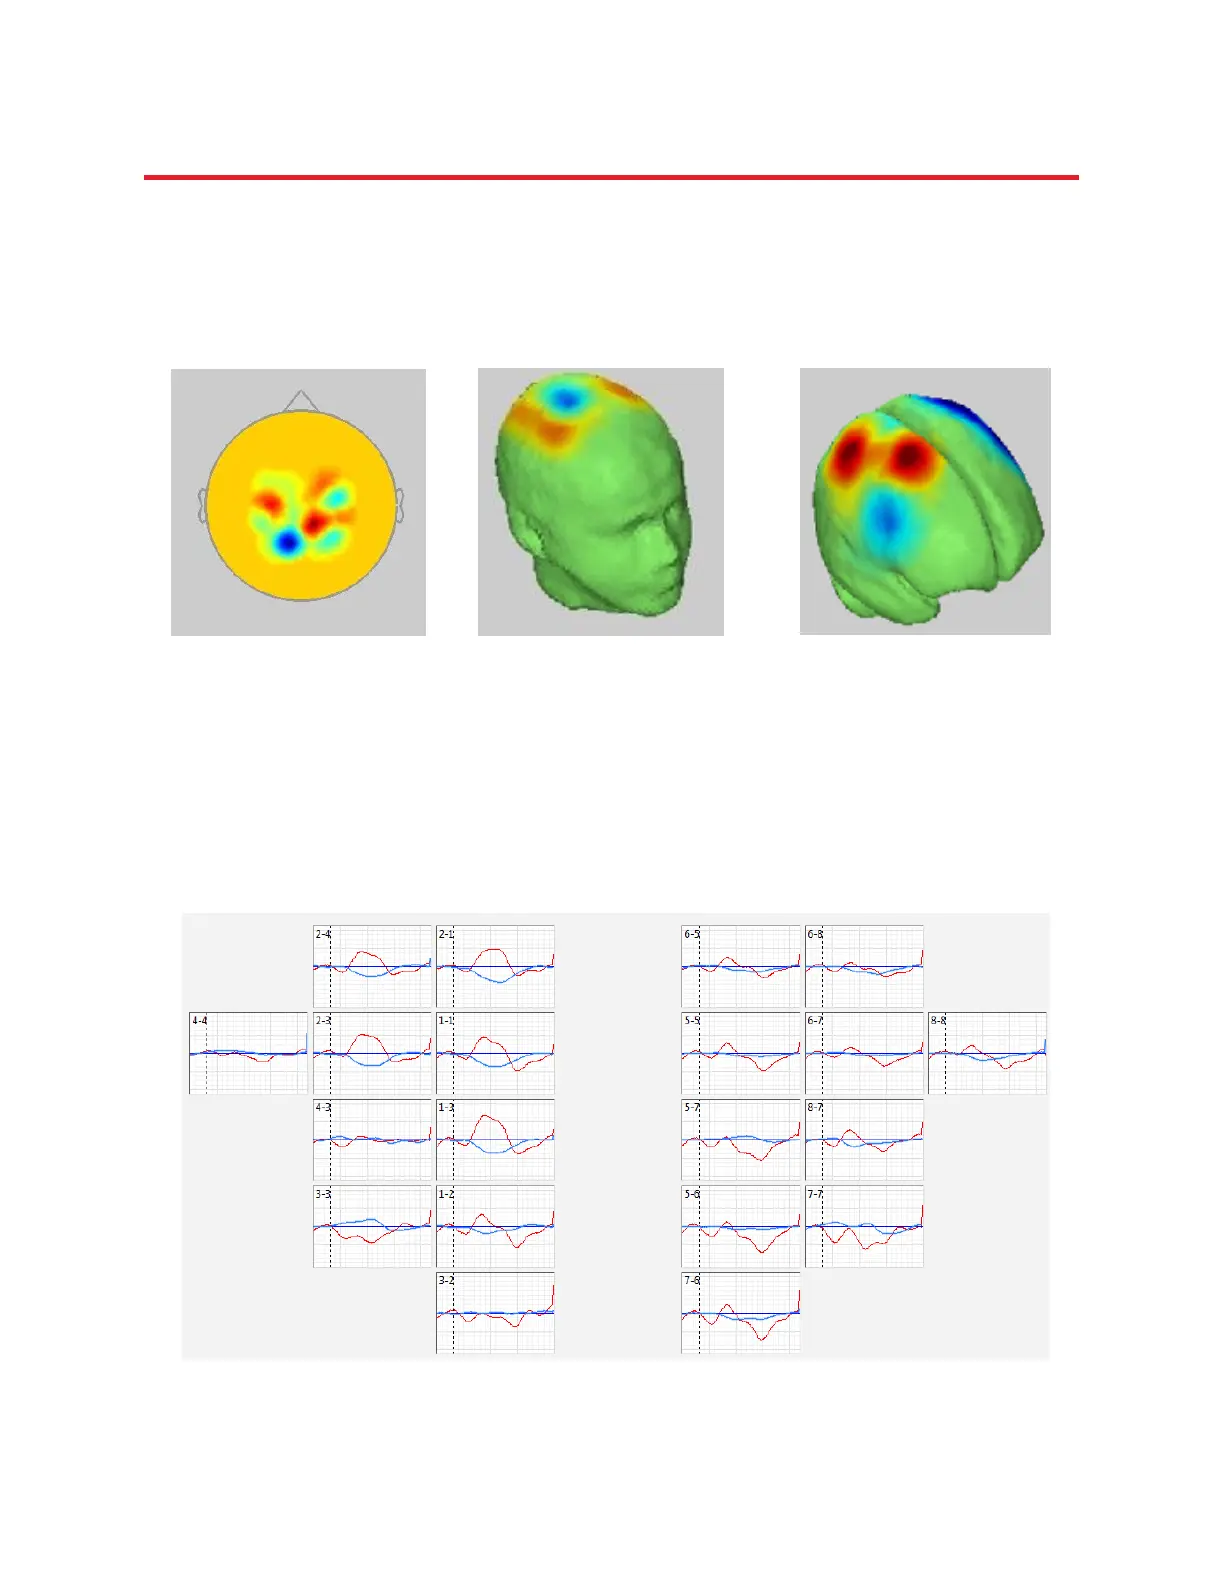
This function provides rendering of the topographic hemoglobin data onto realistic coordinate spaces in
2D or 3D (Figure 68). This functionality is implemented in a separate module distributed with NIRStar,
and requires separate installation (see section 3).
In order to use topographic rendering, click on ‘Launch GUI’ in the ‘Displays Setup’ tab of the hardware
configuration and follow the steps further outlined below (section 18.2).
17.2 Block Average
The Block Average feature allows users to generate topographic displays, in real time, of event-related
data averaged across event epochs, for multiple conditions (Figure 69).
Figure 68. Examples of rendered topographic displays, left to right: 2D, 3D, Cortex
Figure 69. Example of a Block Average display .