NIRStar 14.1 - User Manual
Page 94 of 124
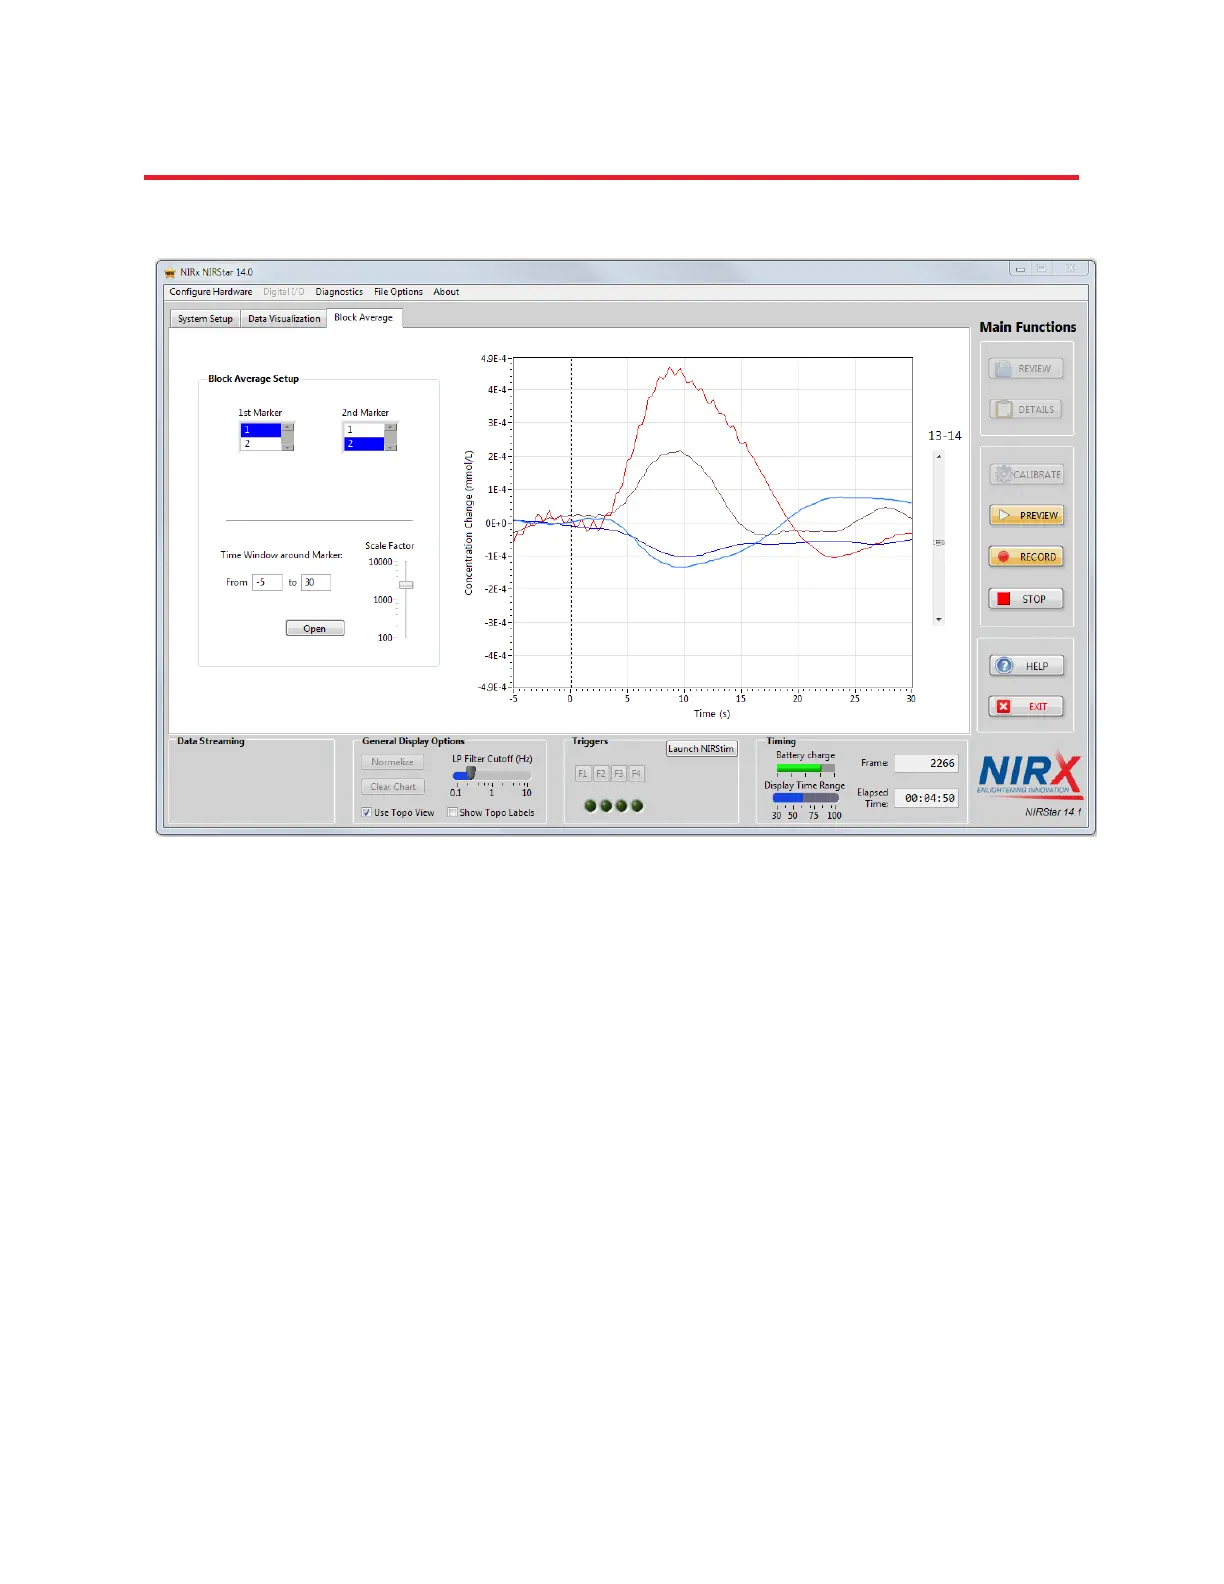
17.2.3 Displaying Real-Time Block Average Plots
The Block Average plot is activated and controlled in the ‘Block Average’ tab of the NIRStar main screen
(Figure 72), under ‘Block Average Setup’. The ‘Block Average’ tab also contains an enlarged plot of one
channel, which may be selected with the vertical scroll bar to the right of the plot.
All display control functions in this tab are applied to the block average displays ‘on the fly’.
1
st
Marker, 2
nd
Marker: Up to two conditions of any two marker values may be plotted at the same time.
Condition one (‘1
st
Marker’) is identified by light red and blue; condition 2 (‘2
nd
Marker’) by deep red and
blue (for HbO and Hb changes, respectively).
Time Window around Marker: Specifies the time axis range for the event-related plots in units of
seconds. The occurrence of the trigger marks time t = 0. By default, the time scale displayed covers the
entire available range set up in the Hardware Configuration (Figure 70). A smaller range may be
specified, with a minimum duration of 0-5 seconds.
Scale Factor: Allows vertical scaling of the Block Average plots. All channels in the Block Average are
scaled to the same y-axis.
Figure 72. Block Average control.