108
Displaying data in graphs
Energy saving
[UserSlct]
z “Setting items freely” (P.116)
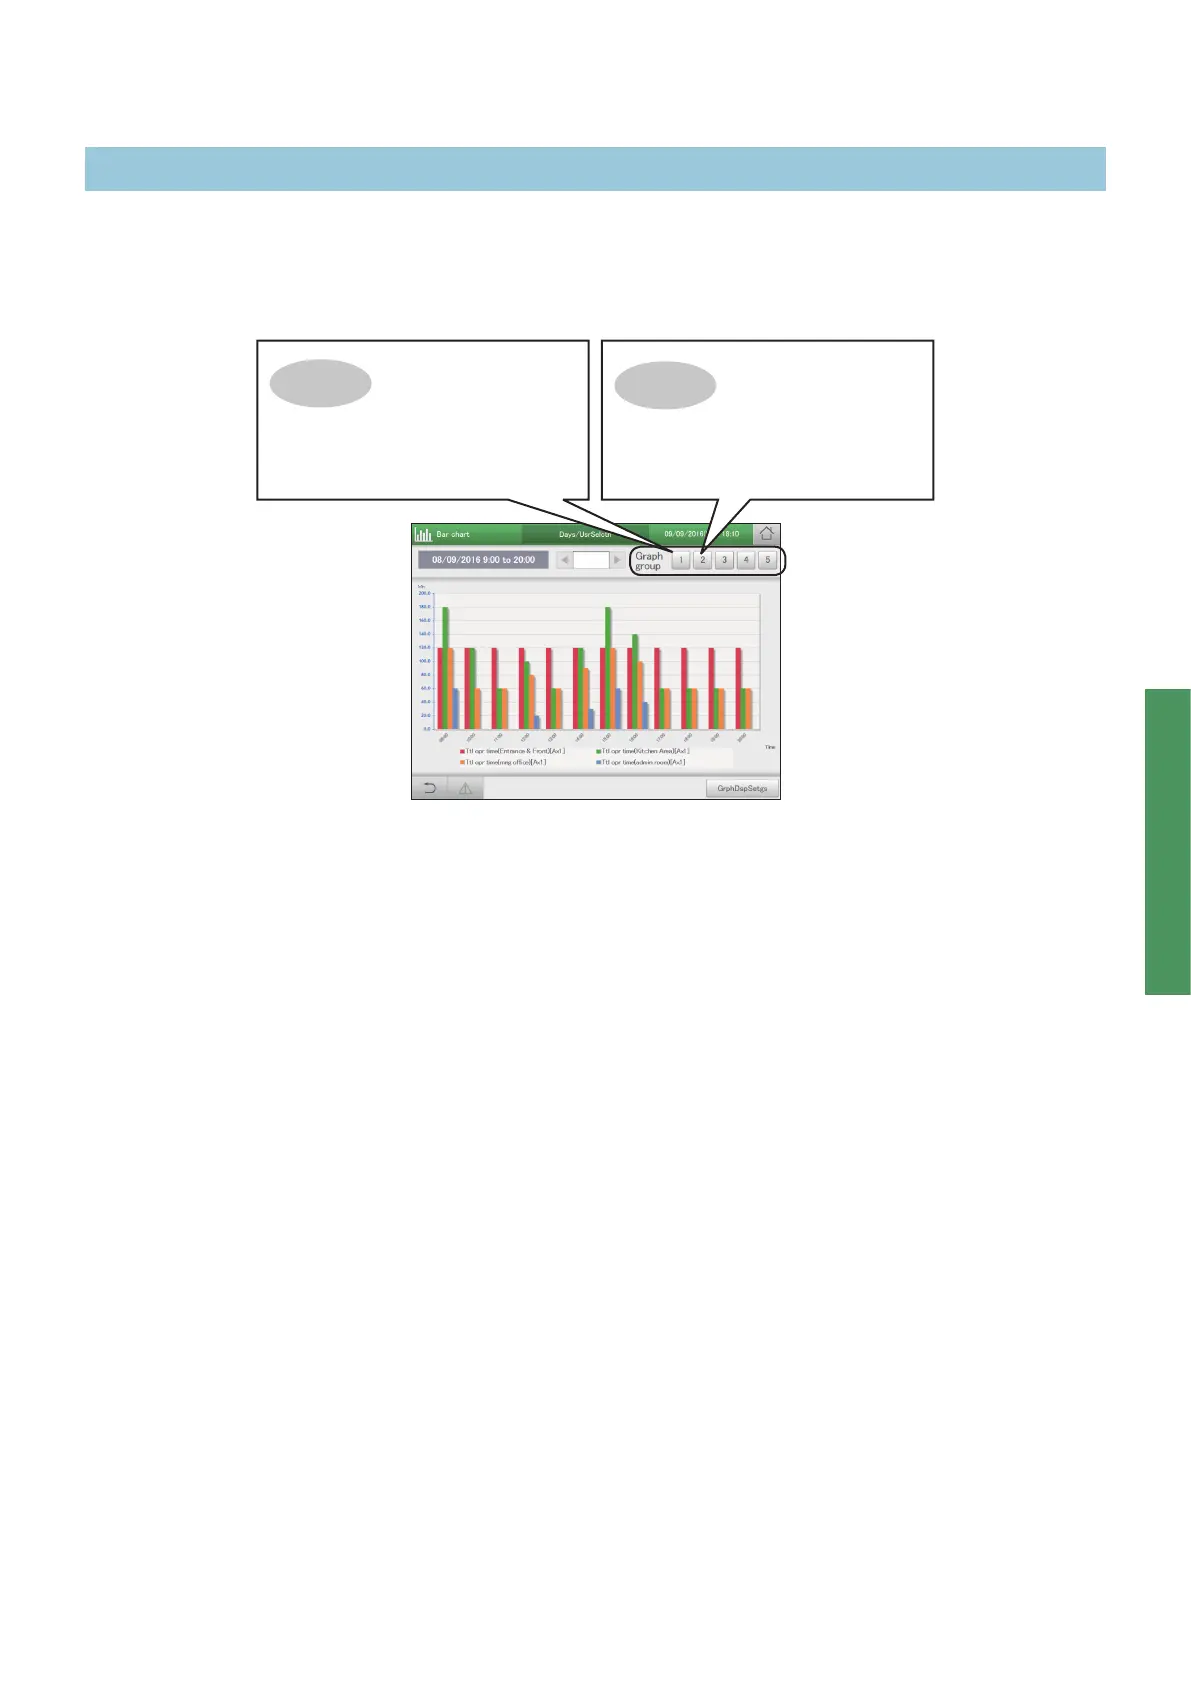
When you select [UserSlct] for both bar charts and line graphs, you can display graphs where you can freely select the units and items. By
registering the settings in “Graph group” to suit their use, you can easily display them without having to select the items every time. (You still
need to set the display period and other items.)
Up to 5 graph groups can be registered.
Example
The monthly transitions
of total operating hours,
thermostat ON operating
times, and electricity usage
for one indoor unit is
registered in graph group 1.
Example
The daily transition of
operation cycles and engine
operating times for 2 outdoor
units is registered in graph
group 2.
Graph display function
 Loading...