115
Displaying data in graphs
Energy saving
11
Set the target values for the axis.
z Touch [Ax1TgtVal] and enter the numbers with the
touchscreen numeric keypad.
z A blue line is inserted to indicate the target values for the
graph.
z You can set any goal.
11
12
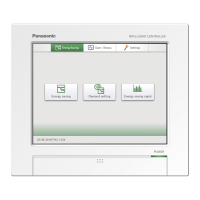
Touch [GraphDsp].
z The graph is displayed in the main screen.
z To cancel the settings, touch [Cancel].
12
Line graph example
Display method
By unit ItemUnts ChngPrDy (ChngPrYr)
*1 *1
*1
*1 You can touch
to change the units displayed (10 units before or after).
Note
y Touch [Graph Disp.Set.] to change the display range and displayed items.
Graphing temperature changes
 Loading...