Page 7
Ph: 804.227.3023
10511 Old Ridge Rd. Ashland, VA 23005
v 2.0
Powertrain Control Solutions
The screen should appear crisp and bright. The contrast has temperature based compensation but depending on the
viewing angle, the screen may be diffi cult to read. Select Display Settings. This screen allows confi guring of backlight and
contrast. Use the arrows to optimize the screen. Once the screen has been adjusted, check the current date and time by
selecting Date & Time from the Display Settings Menu.
The dash has a clock to keep the current date and time. It is important to set the date and time because it is used for
naming and managing data logs. Adjust the date and time to match the current time. Once the date and time are set,
select Save & Back to save the settings. The time and date are not lost when power is disconnected from the dash. To
read more about the Display Settings Menu refer to Section 4.2.7. Press Back to return to the Main Menu.
Now the dash has to be confi gured for any devices connected to it. Select Communications from the Main Menu. The three
communication inputs, RS-232, CAN A, and CAN B, are shown with buttons. Touch the button of the communications input
to setup. For RS-232, select the device connected to the serial port. Once the device is selected, touch the Properties
button to see if there are any further settings for that particular device. The button with DATA PC DASH on it is used to
switch between normal monitor mode and pass-through mode. Select Back to save the RS-232 settings. If a device is
connected on CAN, select the appropriate CAN button and then select the devices on the CAN bus. Select Back to save
the CAN settings. More information regarding communication can be found in Section 4.2.8.
Once communication settings are confi gured, the dash will collect the complete data set from each confi gured source.
However, each individual item from a particular source, such as RPM, must be selected to view the data. From the Main
Menu, select Monitor Settings then Set Display Data. Select the button for the device from which you wish to view data.
Touch the circles for the data you wish to see, and then touch Back. The item labels are shortened to four characters for
display.
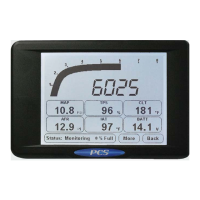
To monitor the data, select Monitor Data from the Main Menu. Each gauge is assigned an item to monitor. To change the
item a gauge monitors, touch the gauge and select the new item. If there are two items with the same name, such as
RPM, refer to the bottom of the screen where the source is displayed. If a particular item is not on the available list, but
was selected in Set Display Data, then it is not available for that particular gauge. For example, the tach slider can only be
assigned to a RPM item.
Units, such as Celsius or Fahrenheit, can be confi gured from the Monitor Settings button on the Main Menu. Also adjustable
from the Units button are tachometer and speedometer ranges for communication devices.
At this point, the dash should be able to monitor all the chosen devices. To confi gure logging, select Data Log Settings
then Sources from the Main Menu. Select either the On-Board Inputs button or the Comm Inputs button. The on-board
inputs have individual selectable logging rates, and the communication logging rates are set at the device level. When a
logging rate is set for a device everything from the device will be logged at that rate. The rates are adjusted by touching
the number next to the item. A value of 10x indicates that device will be logged at 10 times per second (hz). A logging rate
of 0x indicates the device will not be logged.
To manually start a data log, select the More button from the monitor screen then select Start Data Log. To stop a data
log, either turn the unit off, or select Stop Data Log from the More button on the monitor screen. Starting a data log can
also be done by wiring an analog input to a button for more information see Section 6.4.3. The data loges can be played
back on the screen or uploaded to a PC for further analysis.
This concludes the quick reference guide to the dash. Further details and information can be found throughout this
manual. The next step may be to connect to the dash with a computer to verify software and driver installation, and begin
editing the calibration fi le.
4.2 Menu Structure Navigation
The dash’s Main Menu is the top level navigation point for all the menus and screens in the dash. This section describes
each button and the levels below them.