Setting Up Trends 17 Trends
193
3
Place the cursor at a specific time by touching the graph.
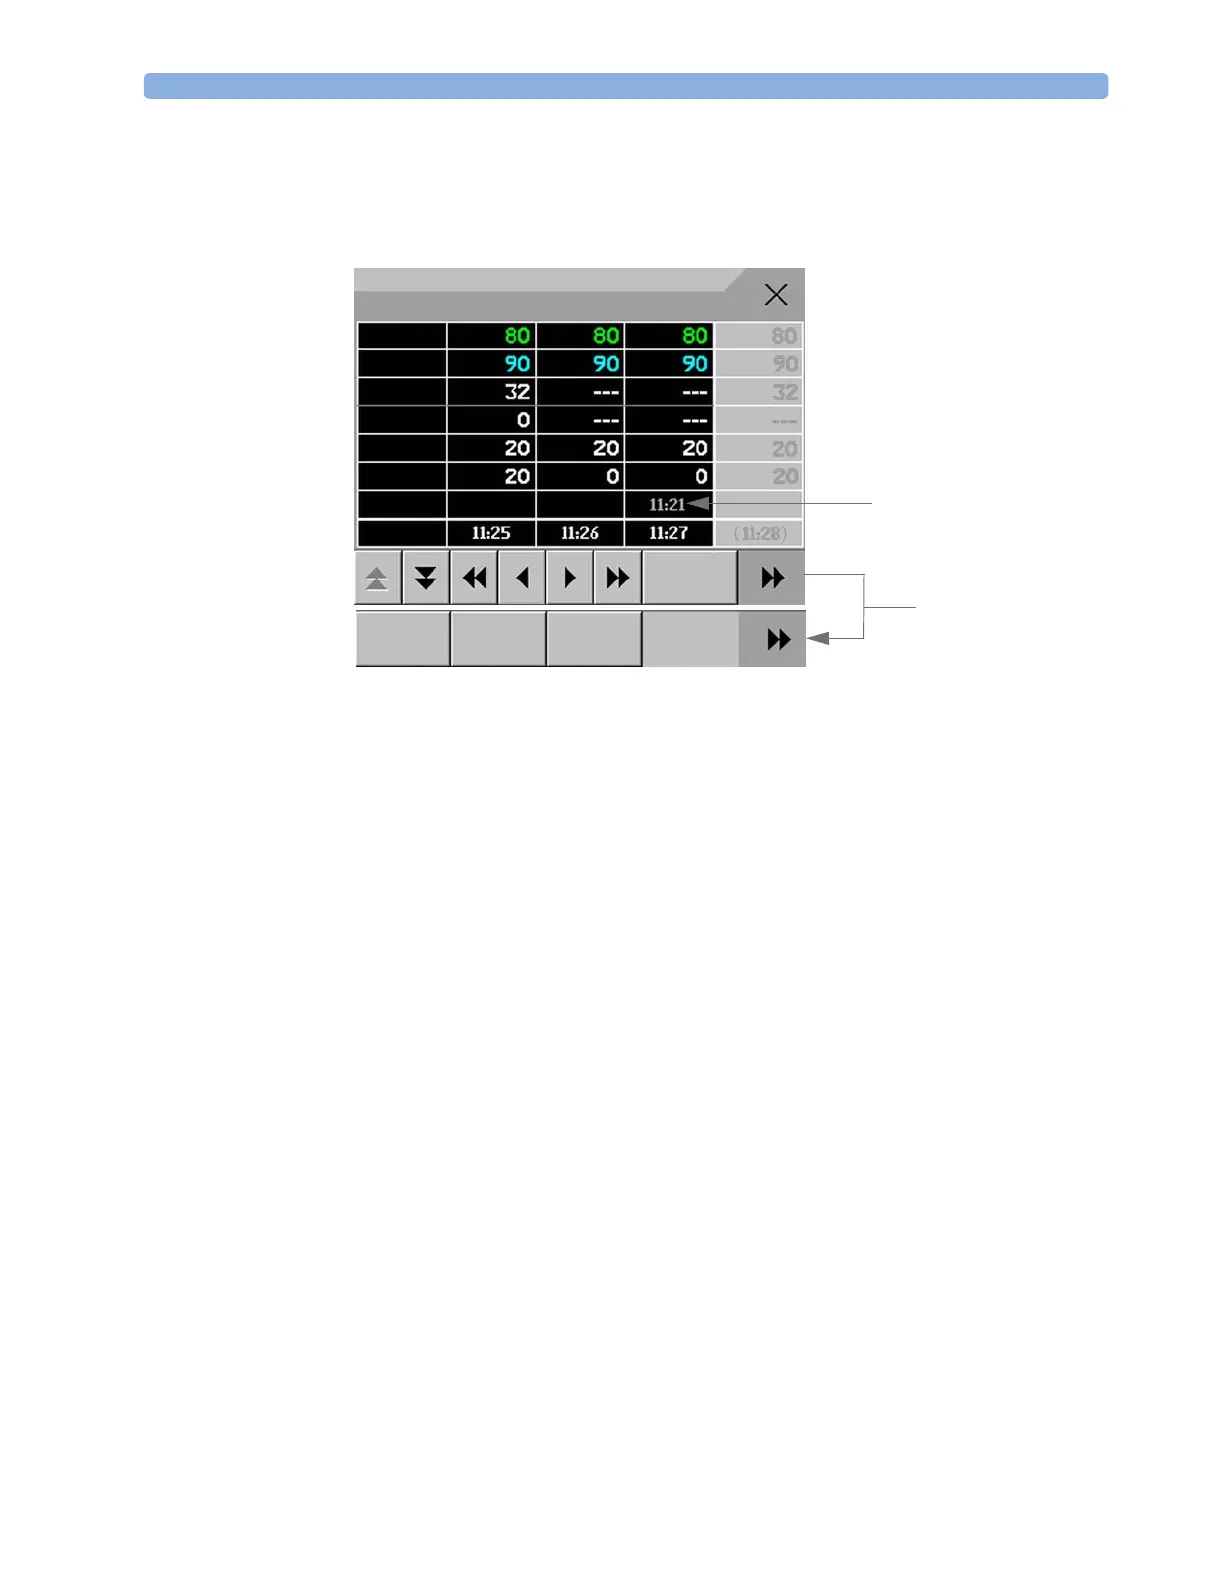
Viewing Vital Signs Trends
The currently-selected column is highlighted. The values can be configured to display in the same
colors as the waves and numerics on the realtime display.
Any values available for display before the next scheduled update are shown in the right hand column,
with a timestamp in brackets.
If more than one value is available for an aperiodic trend for a certain trend period, all measured values
are stored in the database and the value closest to the timestamp is shown in the Vital Signs display
marked with an arrow.
Setting Up Trends
Trends are set up in Configuration Mode. You can make temporary changes to trends settings such as
trend groups, priorities, or scales in Monitoring Mode. The general settings for all Trends are under
Main Setup -> Trends
.
Settings for a single segment in graphical trends or for the corresponding trend group can be made
more easily in that segment menu.
Making Segment Settings
The Graphical Trends window is divided into measurement segments, each of which has its
own settings.
To enter the segment menu,
♦ select the left hand column of the segment, where the measurement label is displayed.
Expanded View
To expand the segment to fill the Graphical Trends window,
♦ in the Segment menu, select Expand to have that segment enlarged to fill the window.
Vital Signs: Standard
HR
SpO
2
etCO
2
Aperiodic values are shown
with a timestamp
imCO
2
RR
awRR
Select
Group
Graph
Trend
Print
Select
Interval
Scroll to view more
pop-up keys
 Loading...