SET-UP & BASIC OPERATION
14
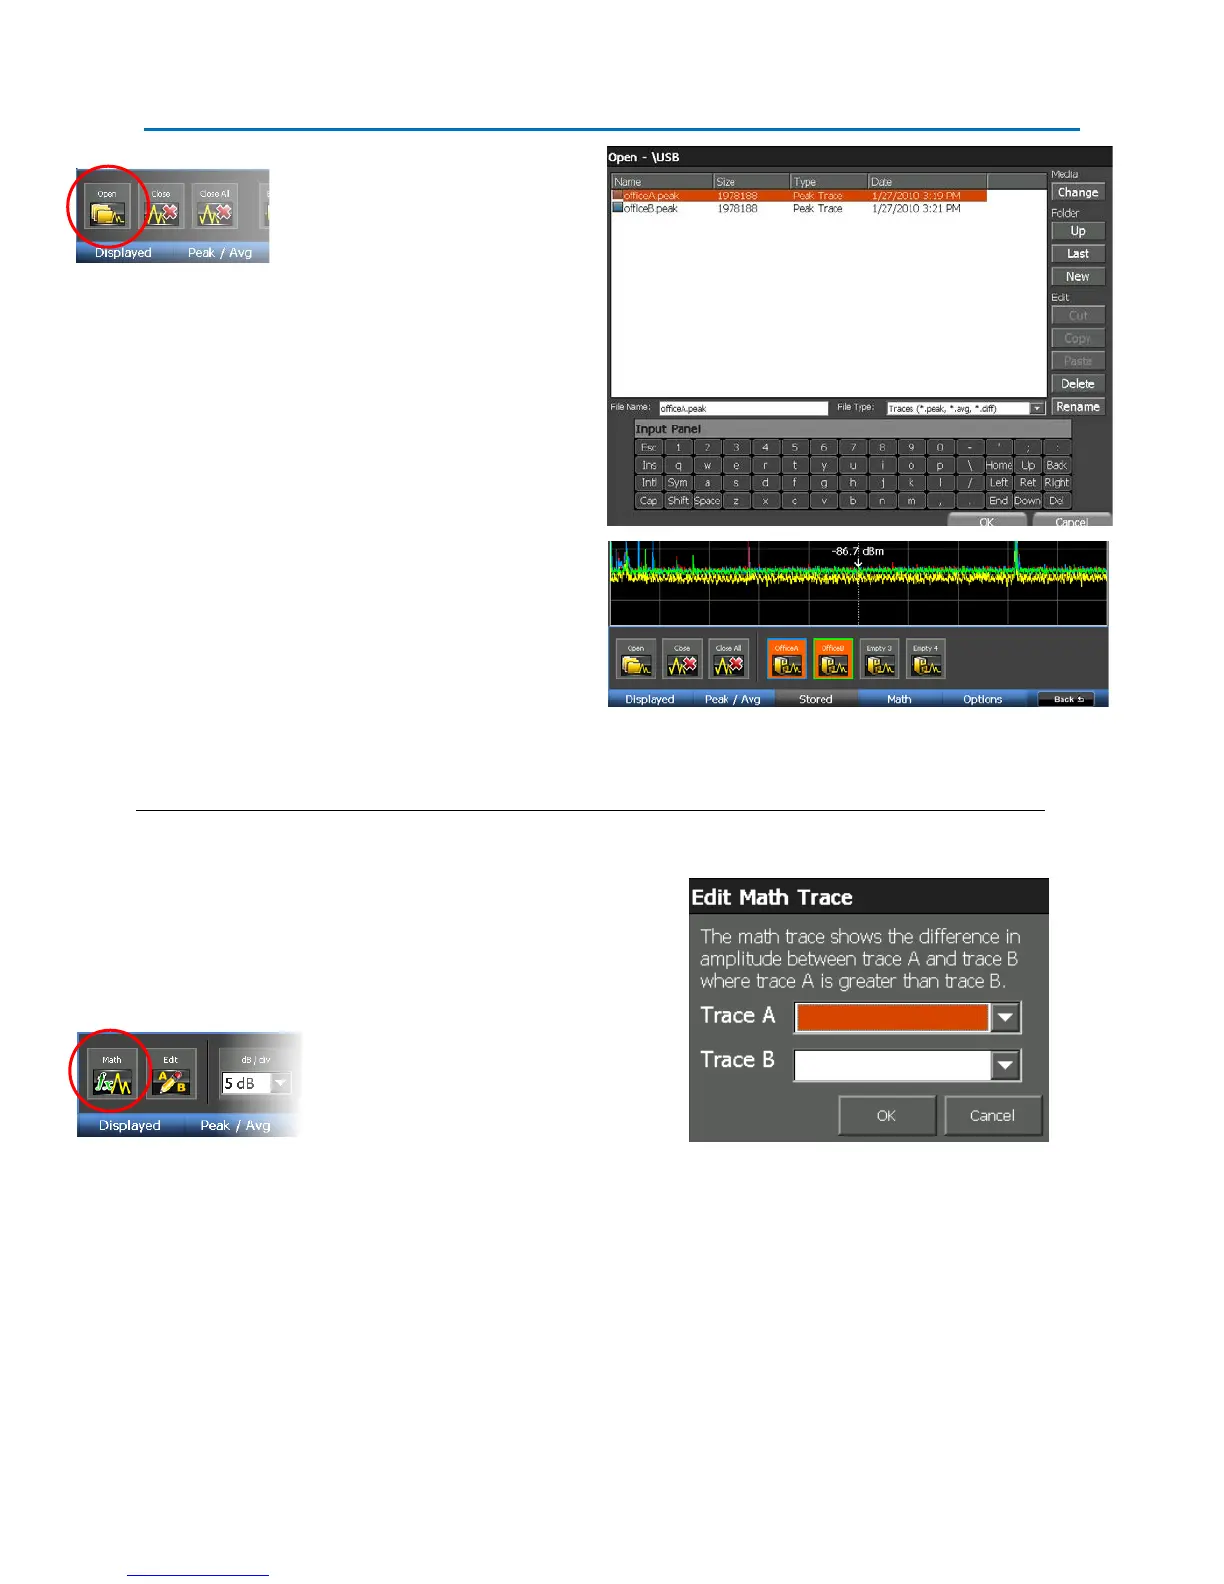
From the Stored Sub-Menu,
select the Open icon. In the
dialog box that appears, find and
select one of the traces that you
saved. Press OK.
This trace will now be displayed
on the screen. Notice that the
Empty 1 icon in the Stored Sub-
Menu now contains the name of
this saved trace and the color of
the outline around the icon will
match the color of the trace in
the spectral display. Repeat the
process for both traces
Note: Up to four saved traces can be opened on the OSCOR unit at any given time. After four traces have
been opened, a trace must be closed before any additional traces can be opened.
Now we want to create a Math Trace
from the two peak traces we just
opened. While still in the Traces Sub-
Menu, press F4 or select Math from the
Traces Sub-Menu.
From the Math Sub-Menu, select the
Mathicon.In the Edit Math Trace dialog
that opens, select the 1
st
saved trace
(Office A) for Trace A and the 2
nd
saved
trace (Office B) for Trace B. Press OK.
Even without your test transmitter, there will be some differences in the traces due to intermittent
transmitters in the environment, such as other cell phones, Wi-Fi, etc… The strongest signal that shows
up on the difference plot should be your test transmitter. It will be necessary to use the methods from
the previous exercise for zooming and navigating the spectral display to locate the test transmitter.
 Loading...