Reference Manual
00809-0100-4360, Rev BA
August 2008
4-3
Rosemount 1151
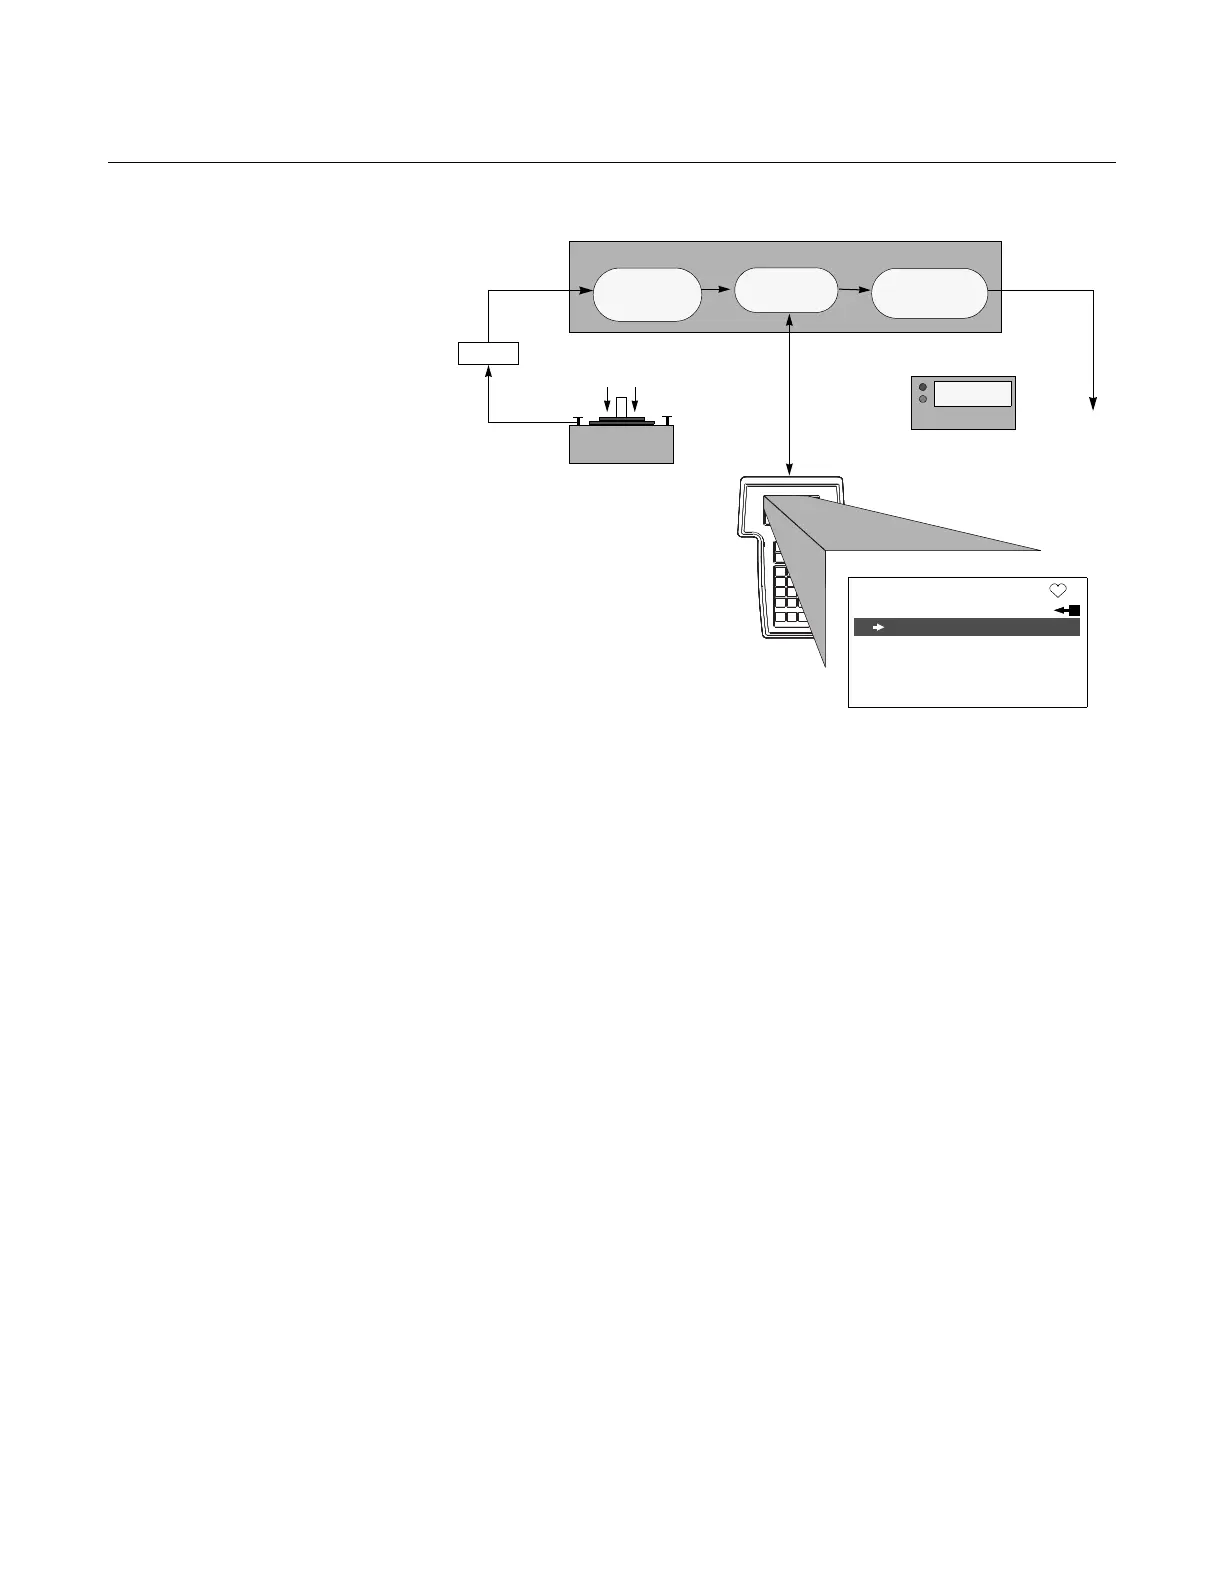
Figure 4-1. Rosemount 1151
Smart Transmitter Data Flow
with Calibration Options.
Figure 4-1 illustrates the Rosemount 1151 Smart transmitter data flow. This
data flow can be summarized in four major steps:
1. A change in pressure is measured by a change in the sensor output
(Sensor Signal).
2. The sensor signal is converted to a digital format that can be understood
by the microprocessor (Analog-to-Digital Signal Conversion).
3. Corrections are performed in the microprocessor to obtain a digital
representation of the process input (Digital PV).
4. The Digital PV is converted to an analog value
(Digital-to-Analog Signal Conversion).
Figure 4-1 also identifies the approximate transmitter location for each
calibration task. Note that the data flows from left to right, and a parameter
change affects all values to the right of the changed parameter.
Table 4-1 identifies the recommended calibration procedures for each type of
Rosemount 1151 Smart transmitter for both bench and field calibration.
HART
Communications
Microprocessor
Digital PV
Digital-to-Analog
Signal
Conversion
Analog-to-Digital
Signal
Conversion
Transmitter Electronics Module
Analog Output
100 inH
2
O
(Transmitter Ranged 0 to 100 inH
2
O)
1151:PT-4001
Online
1 Device Setup
2 PV 100.00 inH2O
3 AO 20.00 mA
4LRV 0.00 inH2O
5 URV 100.00 inH2O
Output Device
20.00 mA
Input Device
NOTES
1) Value on PV line should equal
the input pressure
2) Value on AO line should equal
the output device reading
Sensor
Signal
Input
Pressure
Sensor