Commissioning
58 FLOWSIC600 · Operating Instructions · 8010458 V2.0 · © SICK MAIHAK GmbH
b
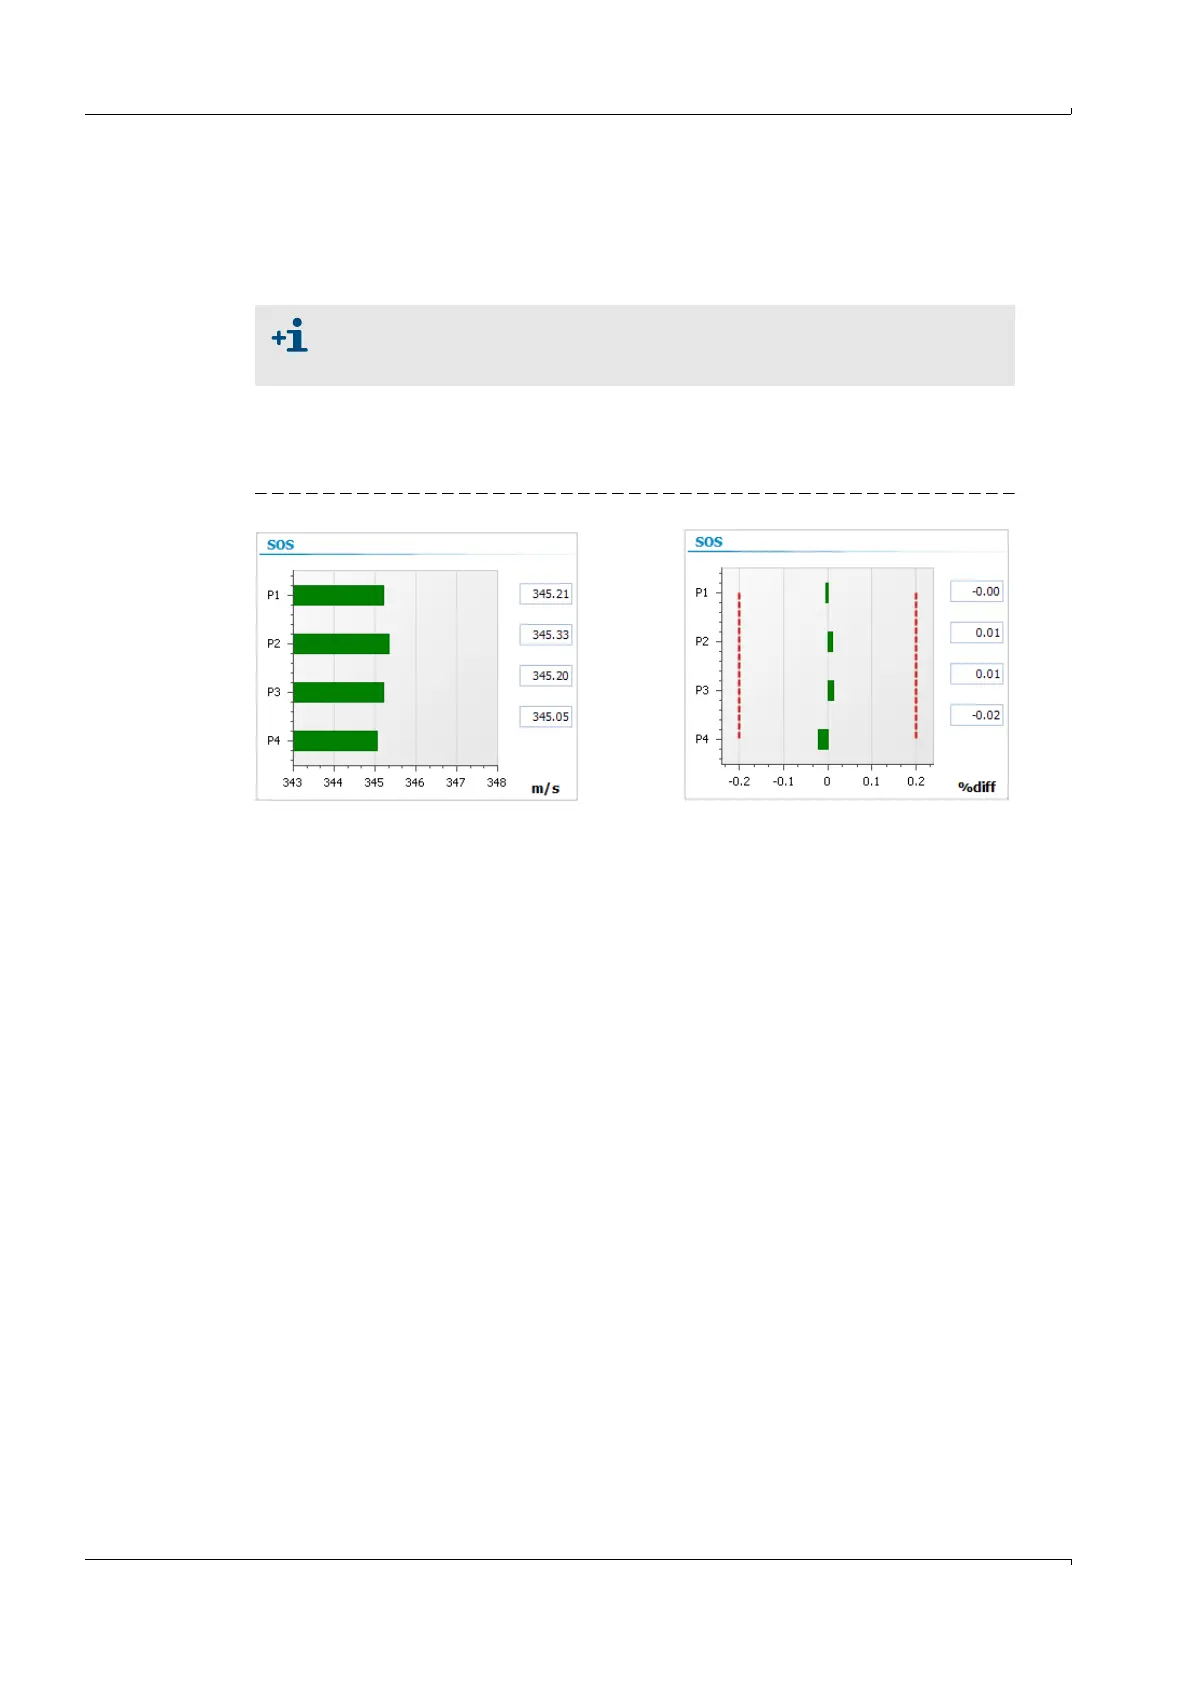
Go to the “Meter values” page to check that the measured SOS values are almost the
same at all paths of the FLOWSIC600, and that they differ by less then 0.1%
(
→
Figure 24).
b
Switch between display of absolute and difference SOS by clicking the right mouse
button on the SOS graph and using the context-menu.
b
Check that the measured SOS deviates no more than 0.3% from a theoretical SOS,
which is calculated from gas composition, pressure and temperature (
→
pg.63, 5.2.1).
Figure 24 SOS per path on the “Meter values” page (left: absolute SOS , right: difference to average)
In the case of very low gas velocities (< 1 m/s or 3 ft/s), there may be more
significant differences between the paths due to thermal stratification. In this
case, the SOS on the upper paths (1 and 2) will be higher than the lower paths.