Plant Visualization
249
7SS52 V4 Manual
C53000-G1176-C182-3
6.6 Plant Visualization
General The switchgear diagram you have created with the DIGSI Plant Configuration (see
Chapter 4.3, page 49) is interpreted and the data set is produced as a result. Further-
more, it serves for the visual monitoring of the substation during operation.
After the Plant Visualization has been started, the current switchgear diagram is load-
ed and displayed. The Plant Visualization enables an on-line presentation of the
measured values, switch states, and assignment to busbars.
DIGSI
at the CU
To use DIGSI for starting the Plant Visualization via a PC connected to the central unit,
proceed as follows:
Open the central unit in the DIGSI Manager in on-line mode.
Click Monitoring in the navigation window.
Double-click Substation data in the function selection. The DIGSI plant visualiza-
tion opens. Alternatively, you can right-click Substation data and then select
Open object in the context menu.
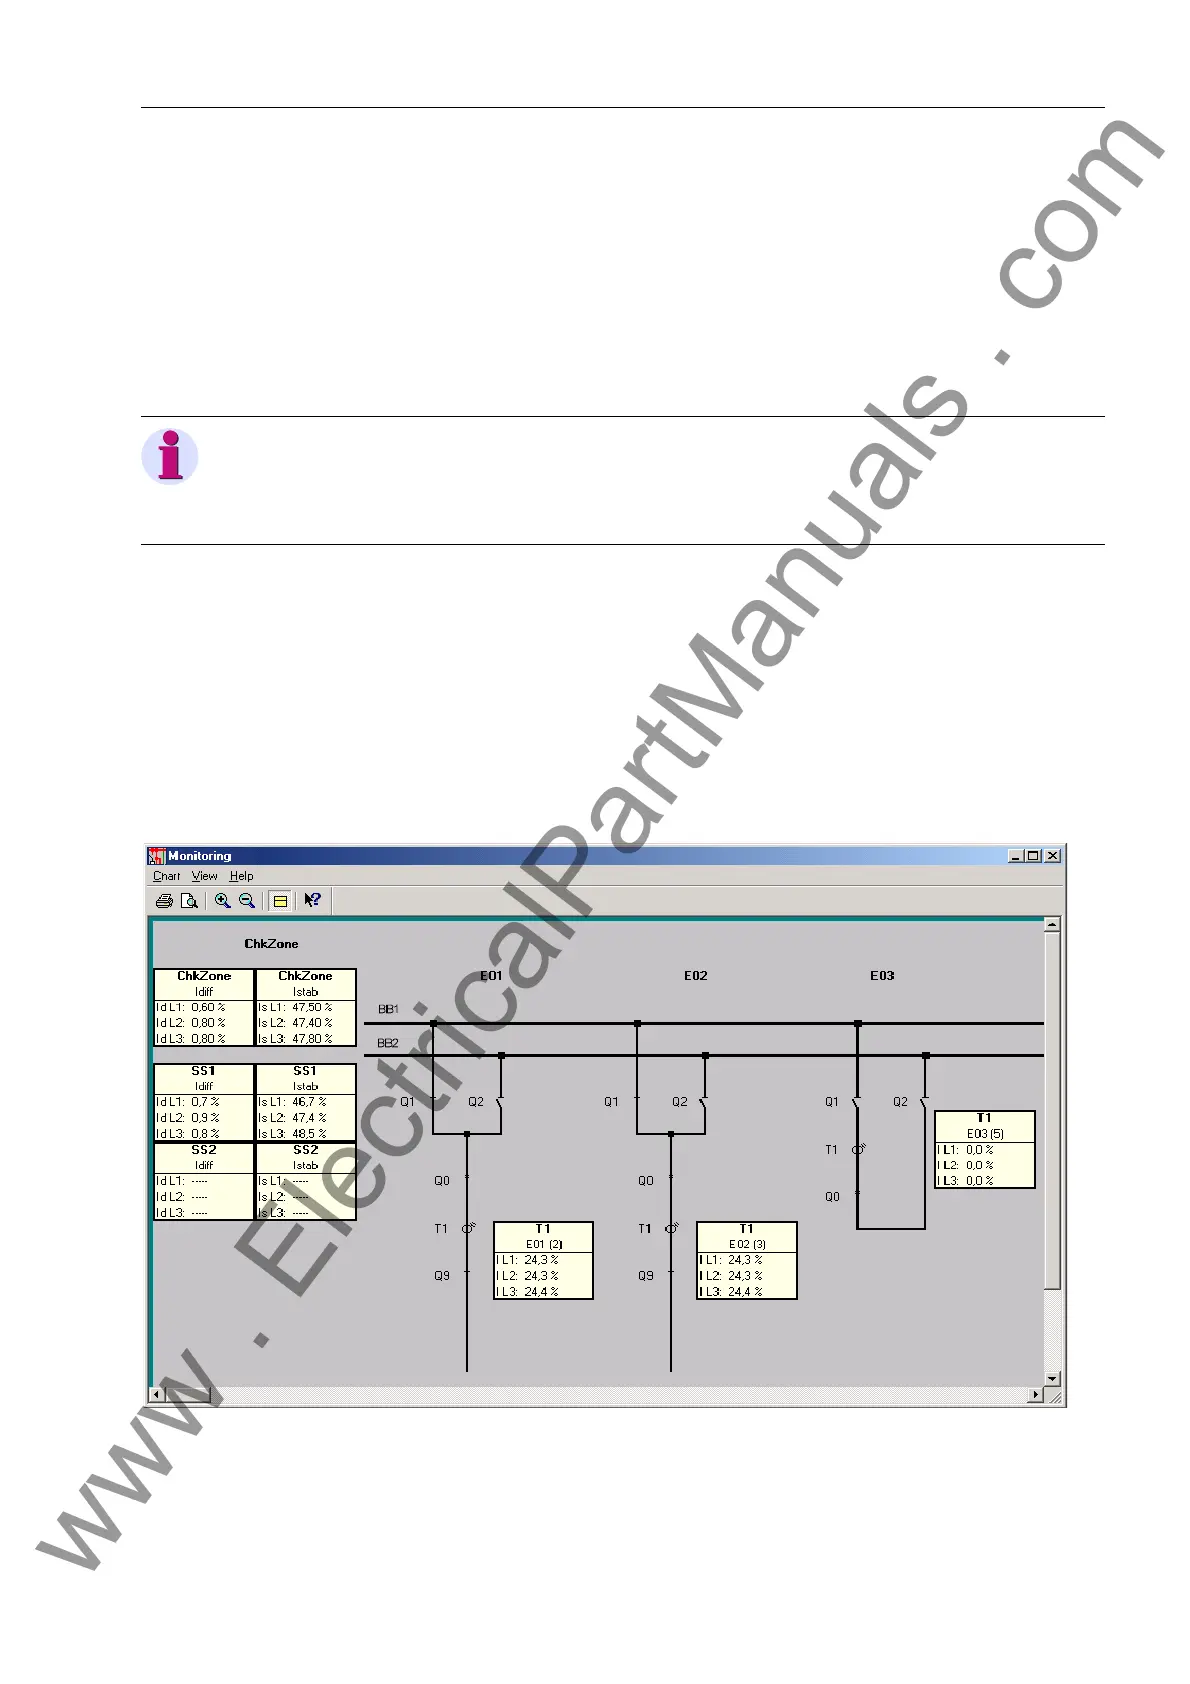
Figure 6-32 Start screen of the module Plant Visualization
Note
For a detailed instruction on how to use the Plant Visualization, please refer to the cor-
responding on-line help. This section describes the basic method for the visual super-
vision of a substation.
www . ElectricalPartManuals . com
 Loading...