36
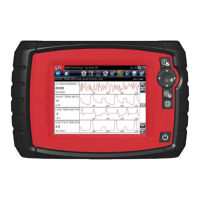
Operations Viewing Data Graphically
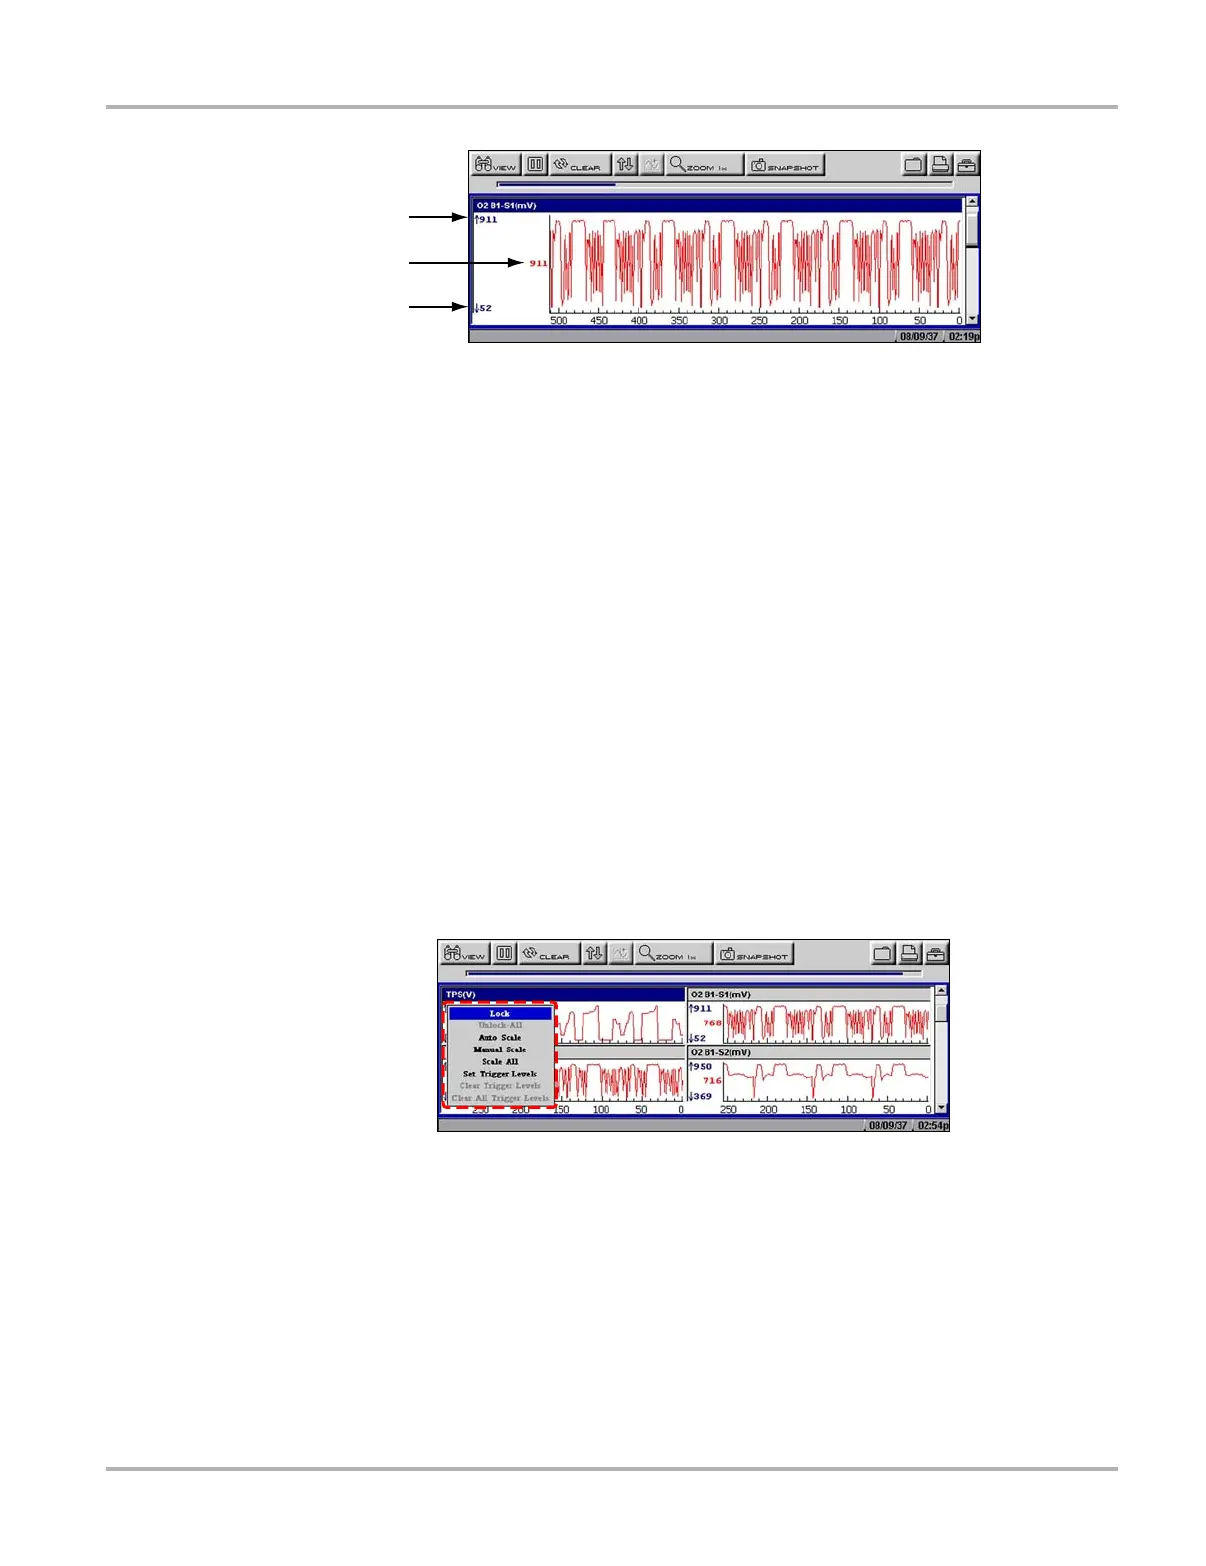
1— Maximum value of captured data
2— Current value
3— Minimum value of captured data
Figure 5-21
Sample graph screen
Parameter Menu
In Graph view, the scan tool offers a parameter menu (Figure 5-22) with the following options:
• Lock—locks the selected parameter into position to compare readings.
• Unlock—unlocks a single parameter.
• Unlock All—unlocks all locked parameters.
• Auto Scale—automatically scales the minimum and maximum values of the selected graph
captured within the last 2000 points.
• Manual Scale—manually scales the minimum and maximum values of the selected graph.
• Scale All—automatically scales the minimum and maximum values of all the graphs.
• Set Trigger Levels—specifies automatic screen-pausing conditions when Snapshot >
PID Trigger is used.
• Clear Trigger Levels—removes triggering conditions from the selected parameter.
• Clear All Trigger Levels—removes triggering conditions from all parameters simultaneously.
Figure 5-22
Sample parameter menu
z To lock a parameter:
1. From the upper toolbar, press the down d arrow.
The highlight moves to the first parameter graph.
2. Select the parameter you want to lock.
The parameter menu displays.
3. Select Lock.
A lock icon displays (Figure 5-21). The locked graph will not move when you scroll through the
remaining graphs.
1
2
3