Paramount GEM User Guide
133 | P a g e
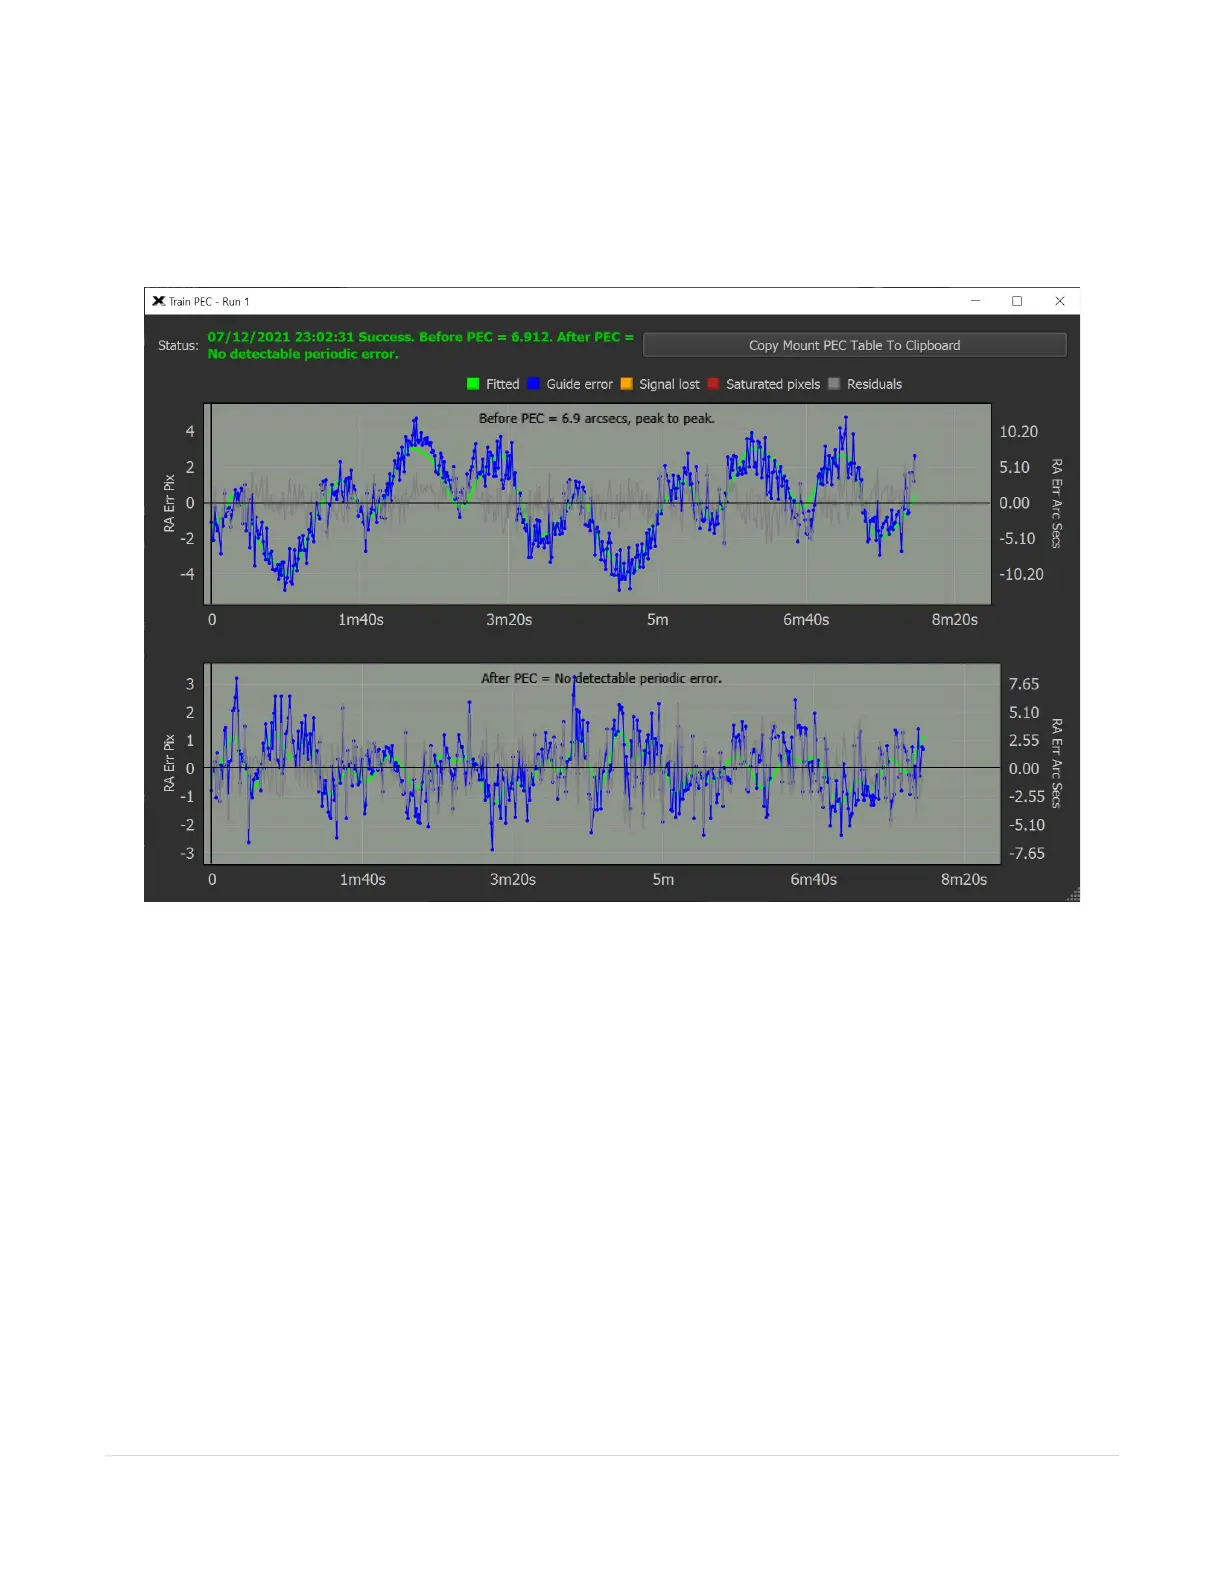
Once the train PEC process is completed, a window showing the results of the process is displayed. Figure 63
shows the results of training the periodic error on a Paramount MX. In this example, the green status message
text shows the results of the process, the before and after periodic error as well as graphs of the before and after
PEC tracking logs.
Figure 63: The results of the Train PEC process.
Train PEC Status
This text describes the results of the Trian PEC process. If the before PEC is less than 7 arcseconds per pixel, the
Paramount maximum specification, and the after PEC shows no detectable periodic error, PEC training was
successful, and you are ready to observe.
Before and After PEC Graphs
The two graphs are displayed on the Trian PEC window so the motion of the reference star before PEC is applied,
and after PEC is applied.
Data Was Collected When Telescope Was Pointing West
This legacy option was used when manually training the mount’s periodic error and is no longer necessary. The
Train PEC button’s functionality supersedes manual PEC training.
Turn this checkbox on if the tracking log data was collected when the telescope was pointing to the West side of
the meridian.