54
Technical data are subject to change without notice.
ISO 9001 certified. © Copyright SPM 1996-9. 71411.B
SPM Instrument AB • Box 4 • S-645 21 Strängnäs • Sweden
Tel +46 152 22500 • Fax +46 152 15075 • info@spminstrument.se • www.spminstrument.se
2
6
3
4
5
1
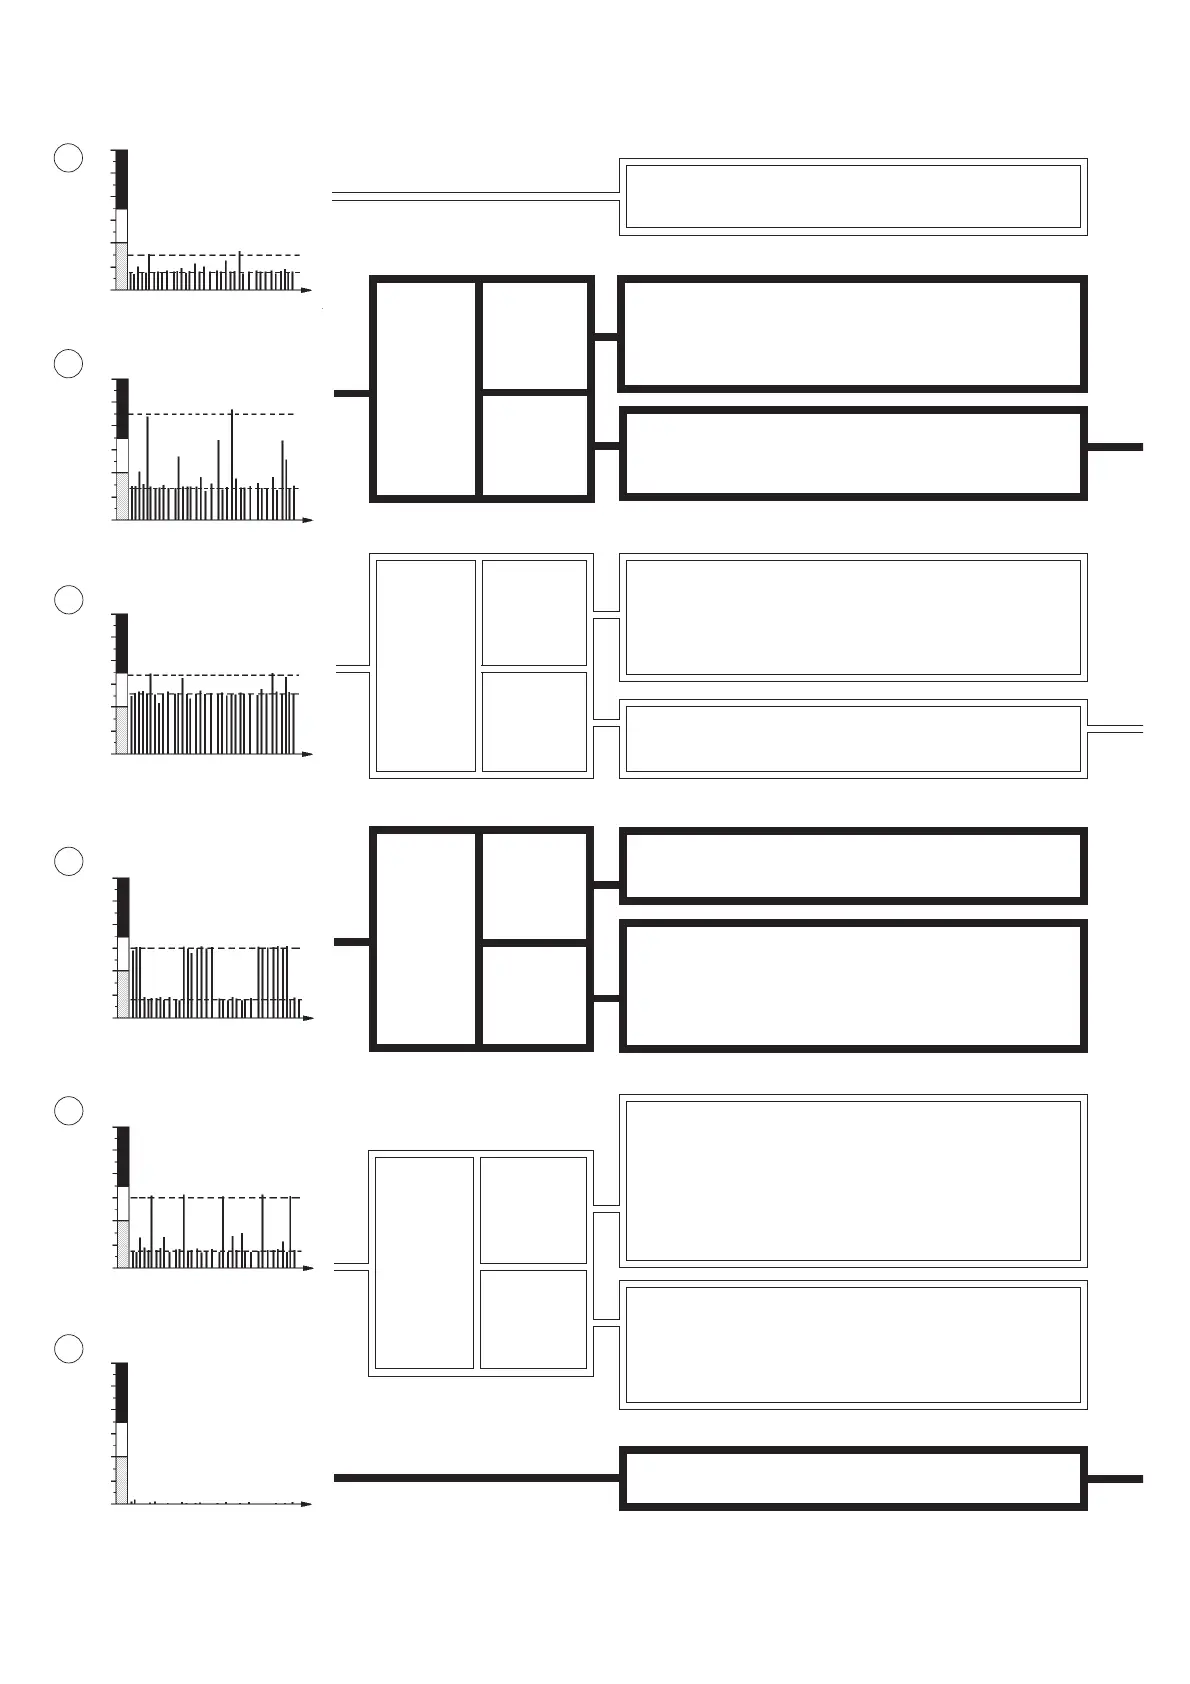
Probable causes:
• The shaft rubs against the bearing housing or the end of the
shaft rubs against the bearing cap
• Gear tooth damage
• Other mechanical rubbing
Newly installed bearing?
Locate the signal source. The reading can be caused by
interference from other defective bearings, cavitation in
pumps or mechanical rubbing. If possible, isolate the source
of disturbance and retest.
Locate the signal source. If possible, isolate the source of
disturbance and retest.
Check the reading of adjecent bearings.
Are the signals from these bearings similar to the tested
bearing?
Locate the signal source. The reading can be caused by cross
talk from other defective bearings or disturbances from other
mechanical shocks. If possible, isolate the source of disturbance
and retest.
On the
bearing
housing
Adjacent to
the bearing
housing
On the
bearing
housing
No or only a very low value can be obtained.
Good bearing condition, installation and lubrication.
Probable causes:
• Load or pressure shocks in the machine's working cycle
causing mechanical shocks in the bearing
• Individual gear tooth damage
• Bearing damage
Where do
you get the
highest
reading?
Where do
you get the
highest
reading?
Where do
you get the
highest
reading?
Where do
you get the
highest
reading?
Adjacent to
the bearing
housing
Adjacent to
the bearing
housing
On the
bearing
housing
Adjacent to
the bearing
housing
On the
bearing
housing
Locate the signal source.
Probable causes:
• Load or pressure shocks from equipment installed on the
machine frame
• Other mechanical shocks from the machine's working cycle
If possible, isolate the source of disturbance and retest.
Evaluation Flow Chart