Changing measurement results
The measurement result displayed in this view can be
changed with the ◄ / ► key.
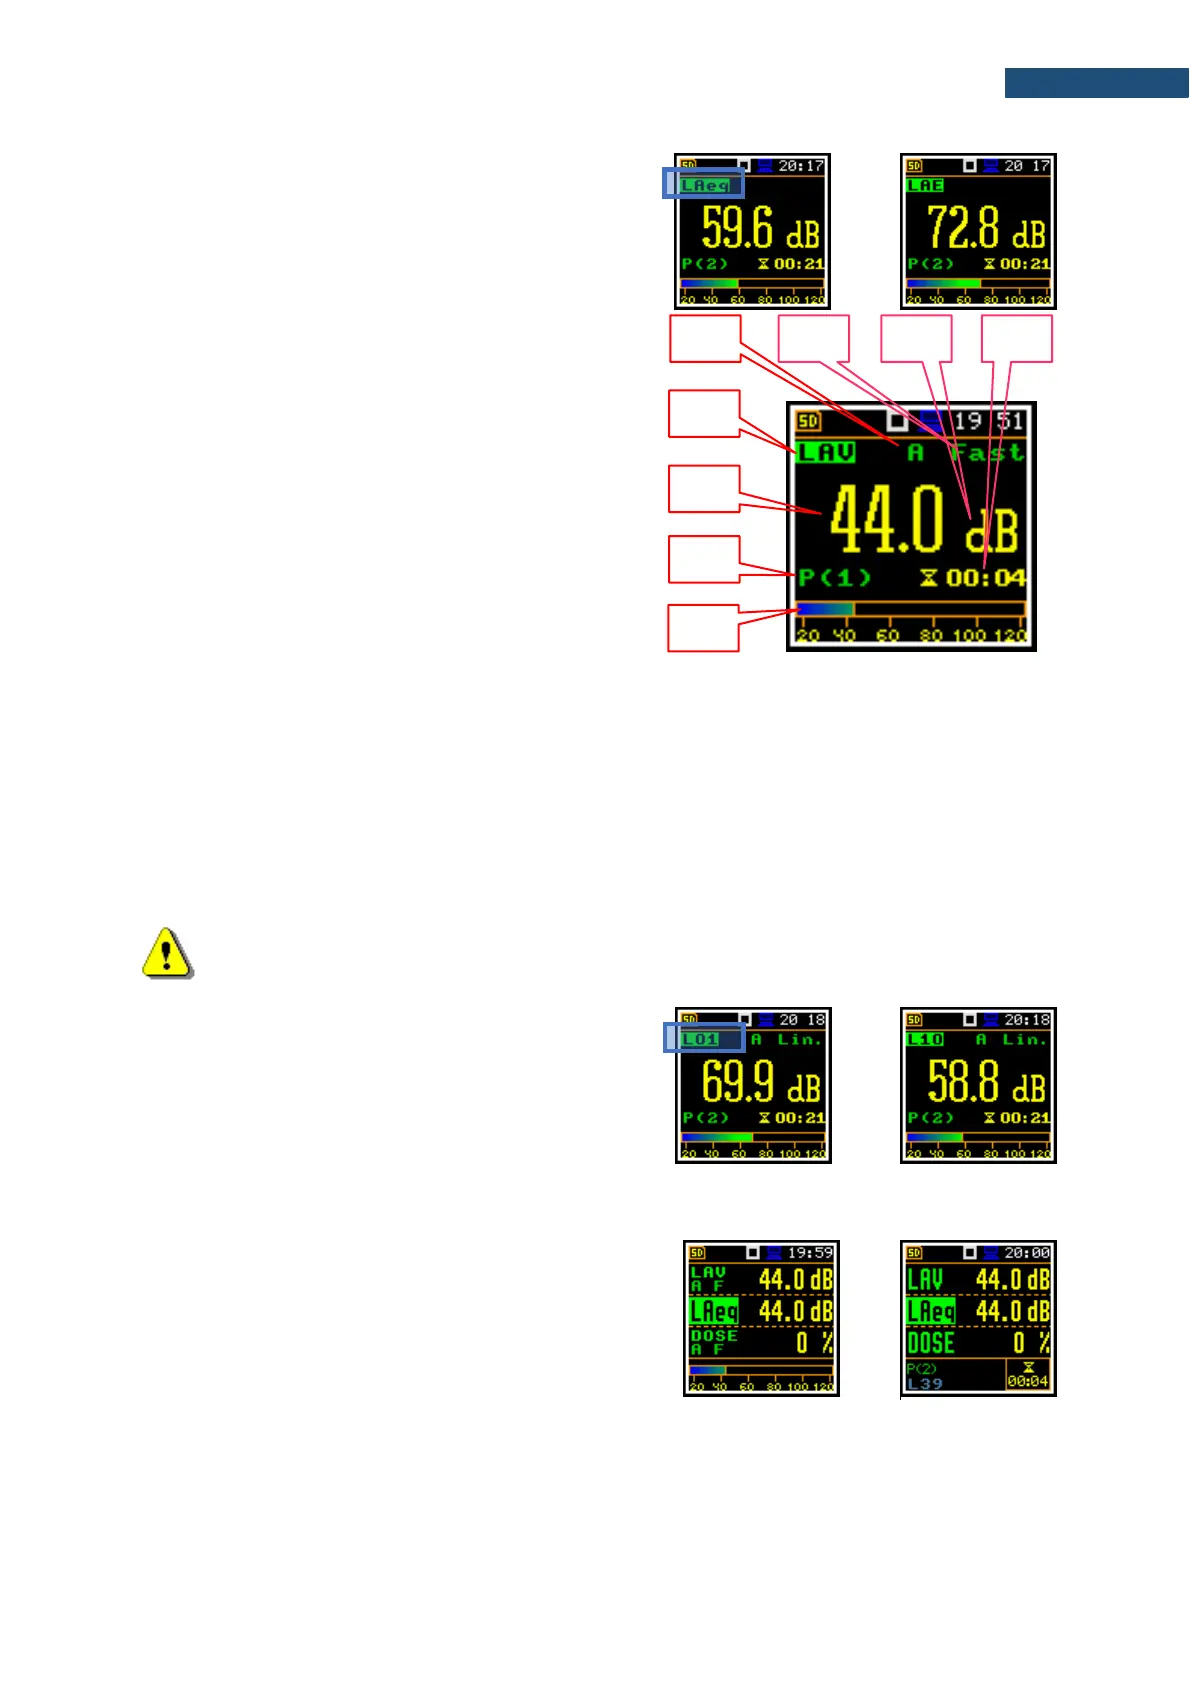
One Result view fields
1. Result name for:
• SLM, 1/1 Oct. and 1/3 Oct. functions: OVL,
Lpeak, Lmax, Lmin, L, Leq, LE, Lden, LEPd,
Ltm3, Ltm5, Ln, EX, SD
• Dosimeter function: OVL, Lpeak, Lmax,
Lmin, L, DOSE, D_8h, PrDOSE, LAV, Leq,
LE, SEL8, E, E_8h, LEPd, PSEL, Ltm3, Ltm5,
Ln, PTC, PTP, ULT, TWA, PrTWA, Lc-a, EX,
SD
2. Value of the measured result
3. Profile number
4. Quasi analogue value indicator
5. Implemented weighting filter: Z, A, C or B
6. Detector time constant: Imp., Fast, Slow for the exponential detector or Lin for the linear detector
7. Units of measured value
8. Elapsed time
Elapsed time shows the current second of the measurement. The value presented there belongs to the
range [0, Integration Period]
Note: For some results, weighting filters and detector type are presented in the result name.
For example, result Lmax with A filter and Fast detector will be presented as LAFmax. For
such results, there is no indication in the filter and detector field.
Changing statistical levels (Ln)
The statistical levels, which are defined in the Stat. Lev.
list (path: <Menu> / Measurement / Stat. Lev.), can be
changed with the ◄ / ► key pressed with <Shift>.
5.1.2 Three profiles view
In the 3 Profil. view any three measurement results,
selected in the Disp. Res list, may be presented for three
profiles. You may change the 3 Profil. sub-view by
pressing the <Enter> key.