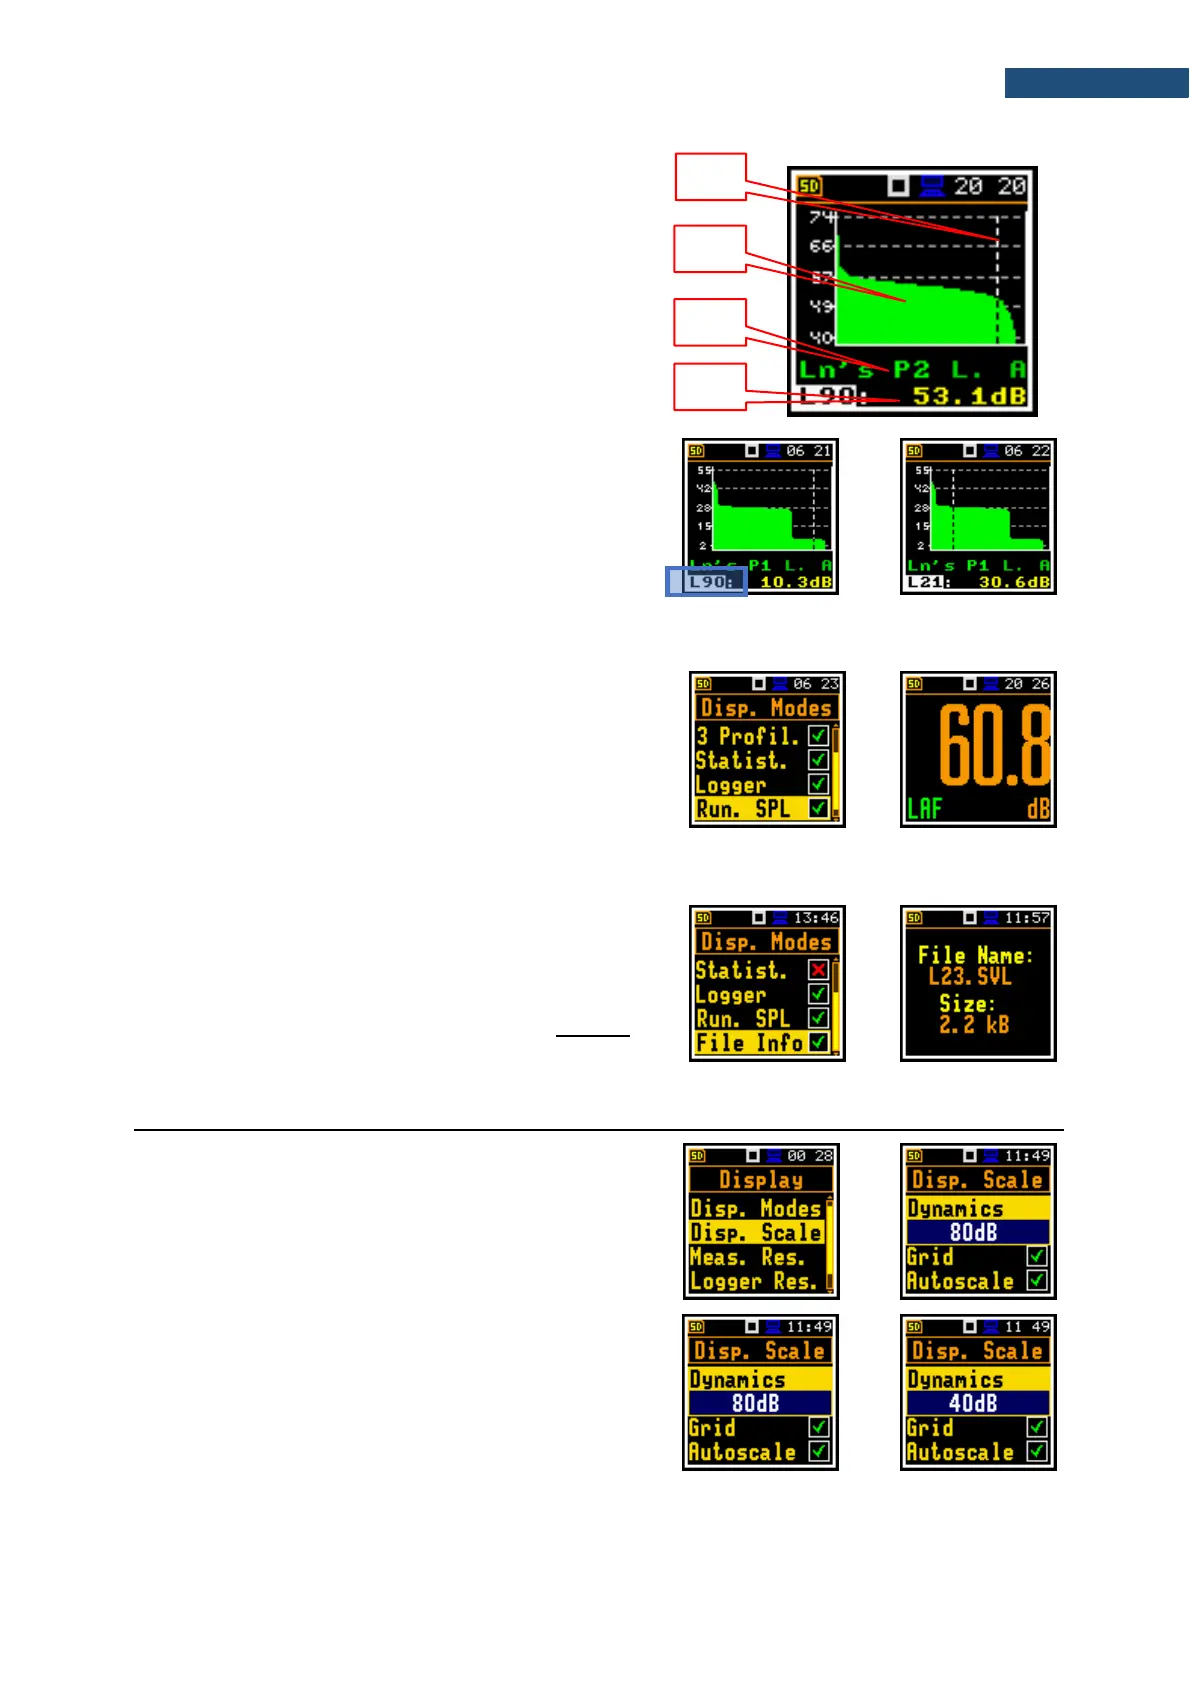
Statistics view fields
1. Cursor position
2. Statistics plot
3. Result name, active profile, LEQ detector (Linear,
Fast, Slow or Impulse), used weighting filter name
(A, C, Z or B)
4. Value of the selected statistical level Ln and
units (dB)
The cursor position can be changed with the ◄ / ► key.
The profile can be changed with the ▲ / ▼ key pressed
with <Shift>.
Statistical levels can be changed with the ◄ / ► key
pressed with <Shift>.
The Run. SPL view shows the SPL result when
measurement is not currently running. In this mode, SPL
result is calculated and displayed, but not stored in the
instrument's memory. The purpose of this view is to give
the user a first indication about the signal to be measured.
5.1.6 File information view
The File Info position enables additional view with
information about the last saved logger file.
The File Info view indicates the file name and its size.
When Logger is Off (path: <Menu> / Measurement
/Logging / Logger Set) the File Info position is disabled.
5.2 ADJUSTING PLOT SCALE – DISPLAY SCALE
The Disp. Scale list of parameters enables adjusting the
scale of the plot and switching a grid on/off in the Logger,
Statistics or Spectrum display modes.
Scaling vertical axis
The Dynamics position enables selecting the required
dynamic range of the plot (Y-axis). It is possible to select
the range from the set: 10dB, 20dB, 40dB, 80dB and
120dB.