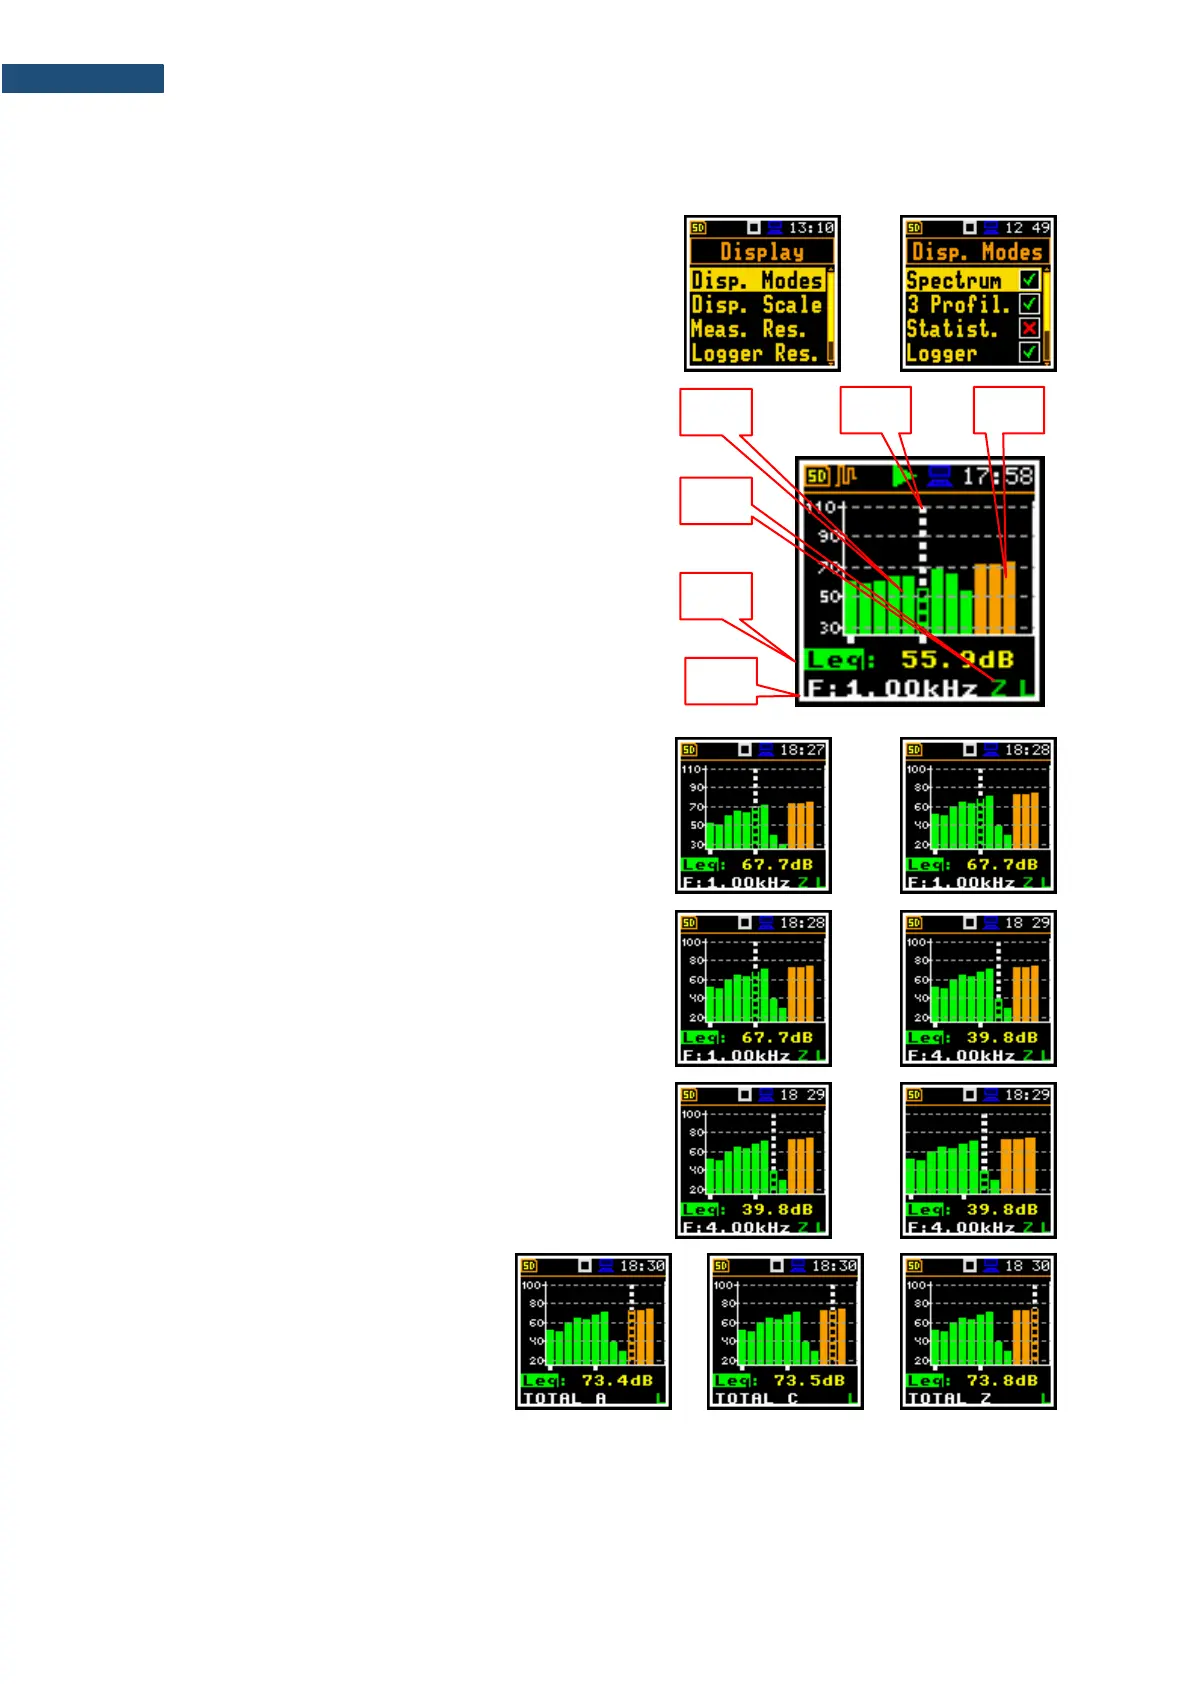
10.3.1 Presentation of 1/1- or 1/3-octave spectra
The Spectrum position in the Display Modes list
becomes available for the 1/1 Octave and 1/3 Octave
functions and enables/disables the spectrum view
(Spectrum).
Spectrum view fields
1. Spectrum plot
2. Type of filter and RMS detector
3. Type of result and its value for the cursor position
4. Central frequency for the cursor position
5. Cursor position
6. Total values
You can shift the Y-axis up or down during the spectrum
presentation by with the ▲ / ▼ key.
You can change the cursor position with the ◄ / ► key.
The frequency and appropriate dB value are presented
in the line below the plot.
Spectrum view can be changed with the <Enter> key.
Second spectrum view doesn’t have the Y scale and thus
has wider bars.
Total values are calculated with the
filters A, C and Z, and are displayed at
the bottom line of the screen when the
cursor has been placed on the
appropriate orange bar.