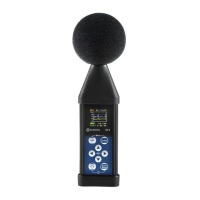
Field description of the 3 Profiles mode
1. Result for the first profile
2. Result for the second profile
3. Result for the third profile
4. Implemented weighting filter: A, C, Z or B and
detector time constant: I (Impulse), F (Fast), S
(Slow) when the detector is exponential or L when
the detector is linear
Changing measurement results
To change the result of the profile, you should select
the profile with the ▲ / ▼ key and then change the
result with the ◄ / ► key.
The statistical levels can be changed with the ◄ / ►
key pressed with <Shift>.
In the Logger view, the time history results, selected in
the Logger View list, are displayed as a plot. You may
change viewed results by pressing the <Enter> key.
The cursor position can be changed with the
◄ / ► key.
Logger view fields
1. Logger Plot
2. Result value for cursor position
3. Result name (Profile number)
4. Cursor time position
Note: If Logger (path: <Menu> / Measurement / Logging /Logger Set.) is switched off the
Logger presentation mode is disabled! Therefore, to have this presentation mode active,
switch the Logger on!
Note: When Logger is switched on, but results were not selected for logging the Logger
presentation mode is disabled!
“Statistics” is the cumulative probability density function of exceeding the noise level during the
measurement period. The X axis defines the probability of exceeding the noise level, statistical level Ln,
and the axis Y defines the calculated noise level in dB.

 Loading...