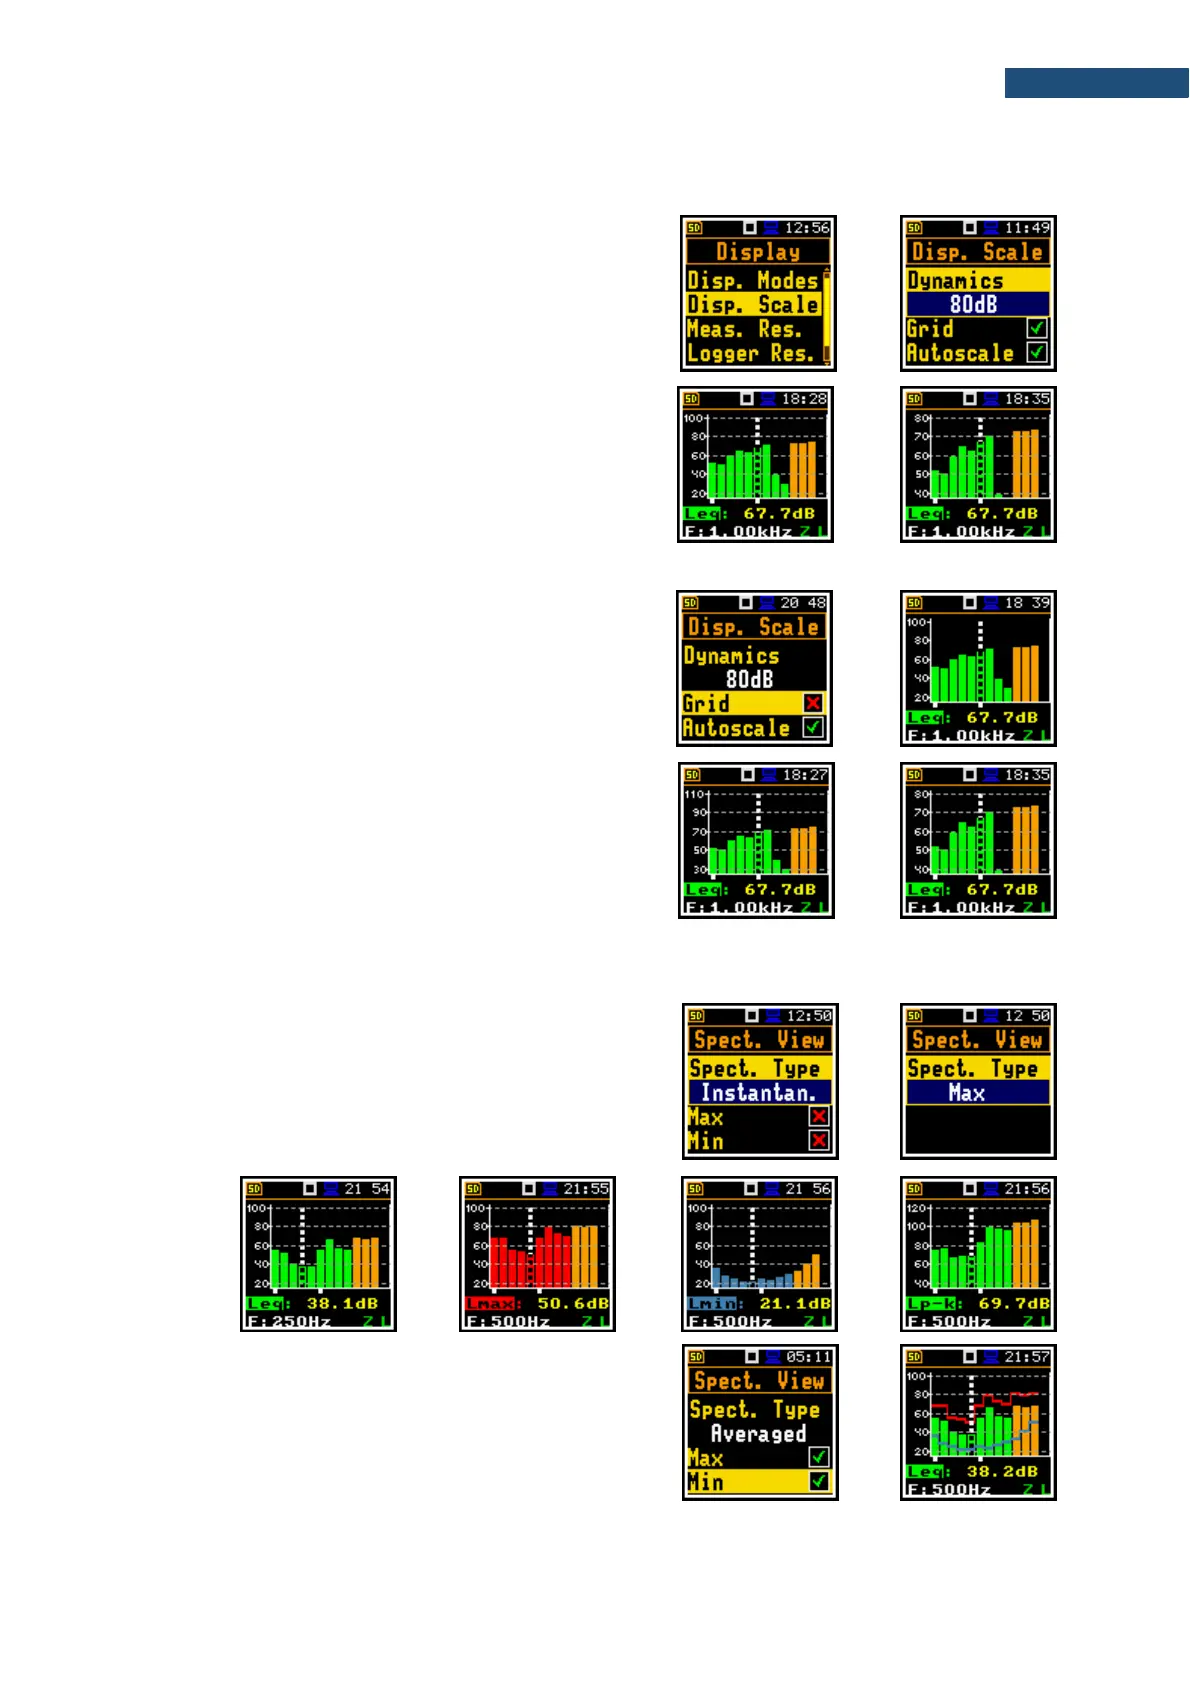
10.3.2 Adjusting spectrum plot scale – Display Scale
The Disp. Scale position allows you to change the scale
of the spectrum plot and switch the grid and automatic
scale adjustment on/off.
Scaling vertical axis
The Dynamics position enables selecting the required
scale dynamic range of the spectrum plot. It is possible
to select the range from the set: 10dB, 20dB, 40dB,
80dB and 120dB.
The attached example shows spectrum view with 80dB
and 40dB dynamics.
Switching grid on/off
The Grid position switches on or off the grid in the
spectrum view.
Automatic Y-scale adjustment
The Autoscale position switches on or off the automatic
adjustment of the Y-axis scale dynamic range to the
current spread between lowest and highest measured
octave or third octave results.
10.3.3 Selection of spectra to be viewed – Spectrum View
In the Spectrum View screen, which appears in the
1/1 Octave or 1/3 Octave functions, you can select
different spectra to be visible on the display
(Spect. Type): Averaged, Instantaneous, Max, Min
and Peak.
Below are views of different spectra.
Minimum and maximum spectra can be presented at the
same plot with the Averaged and Instantaneous
spectrum when the Max or/and Min parameter is
switched on.