10.2.2 Logging 1/1- or 1/3-octave spectra – Logging
Spectra are always logged together with the Summary results in a logger file with
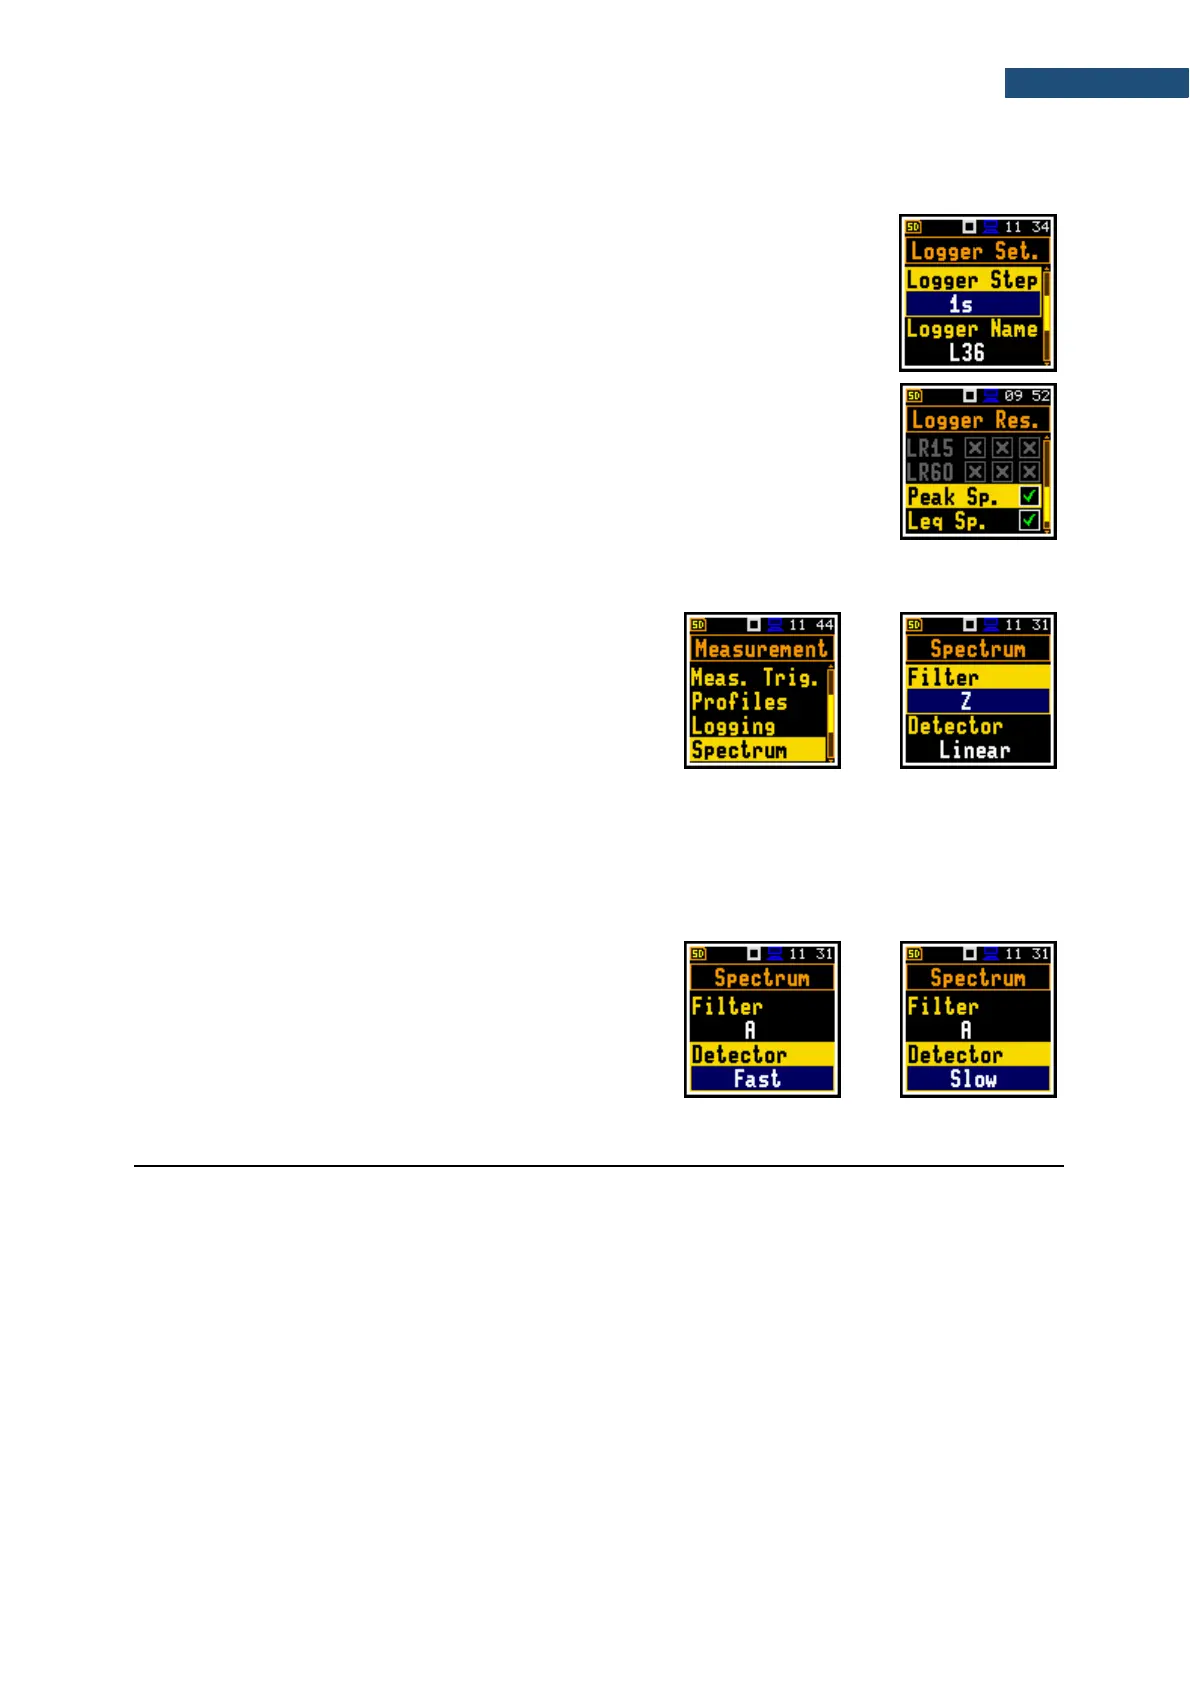
Integration Period step. The first condition should be fulfilled, namely the Logger
must be switched on (path: <Menu> / Measurement / Logging / Logger Setup /
Logger: On).
The Leq and Lpeak results from the 1/1-octave or 1/1-octave analysis can also
be saved in the logger file with the step defined by the Logger Step parameter
(path: <Menu> / Measurement / Logging / Logger Setup). The enabling of
spectrum saving in the logger file is made by checking the Peak Spectrum or
Leq Spectrum position with the ◄ / ► key.
10.2.3 Setting parameters of 1/1- or 1/3-octave analysis – Spectrum
For active 1/1 Octave or 1/3 Octave functions, the
additional position (Spectrum) appears on the
Measurement list.
The Spectrum position enables selecting the pre-
weighting broadband frequency filter and the LEQ
detector for the octave or third octave analysis.
Following weighting filters are available for the 1/1 and 1/3-octave analysis:
• A according to IEC 651 and IEC 61672-1:2013 for Class 2,
• C according to IEC 651 and IEC 61672-1:2013 for Class 2,
• Z according to IEC 61672-1:2013 for Class 2,
• B according to IEC 651 for Class 2.
Filter characteristics are given in Appendix C.
The Detector parameter can be set to Linear, Fast or
Slow.
10.3 CONFIGURING 1/1- OR 1/3-OCTAVE SPECTRA VIEWS
The Display section is used for setting various parameters, which are mainly dedicated for control of the
spectrum view. Following positions are used for setting up presentation of 1/1 and 1/3-octave results:
Disp. Modes allowing you to enable the Spectrum view;
Disp. Scale allowing you to adjust scales of the spectrum plot and switch on/off the grid;
Spect. View allowing you to select spectra to be viewed: instantaneous, averaged, maximum
or minimum.