METER Mode
3–42
THS710A, THS720A, THS730A & THS720P User Manual
Data Logger Display
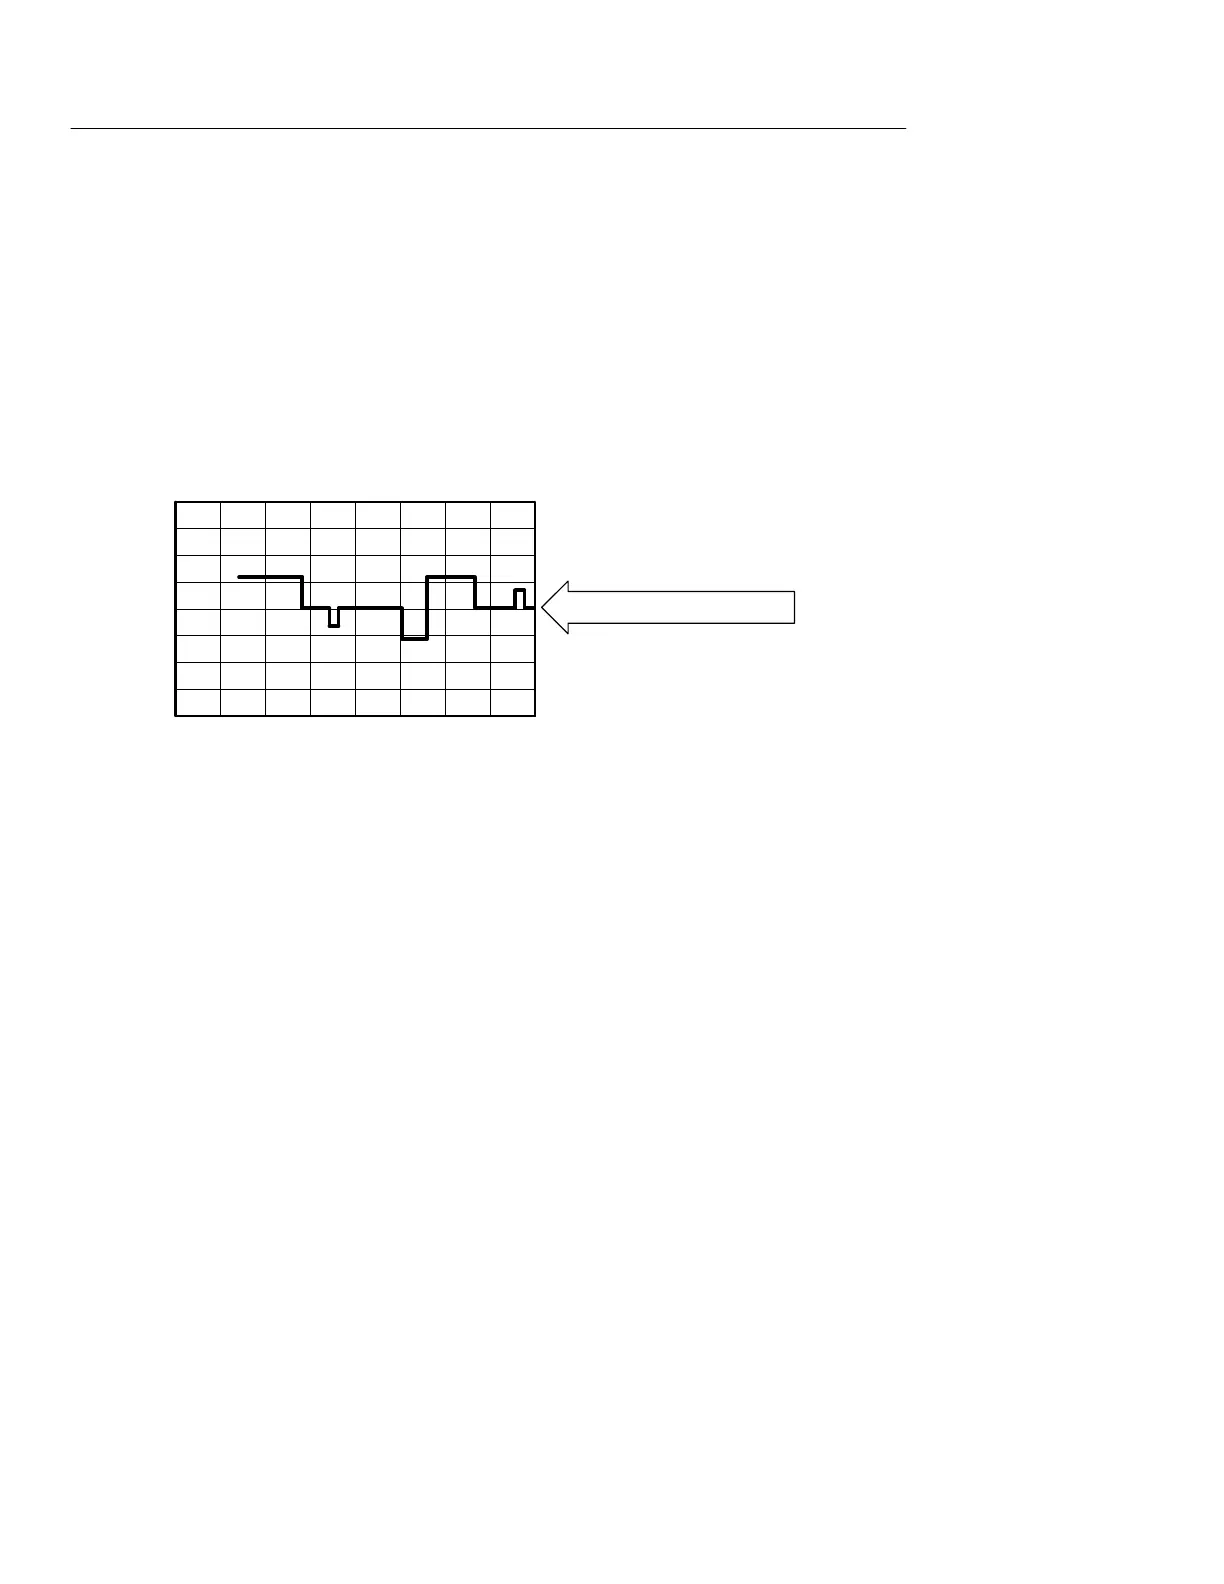
The data logger records meter measurements over a period of time,
creating a plot similar to a strip-chart recorder. You can set the time
span of the plot from four minutes to eight days.
The data logger plot scrolls to the left. The most recent data is
always at the right end of the graticule. The oldest data disappears
off the left side of the graticule and is erased.
Data logger scrolls to the left
Reset. The TekScope instrument erases the waveform in the data
logger plot if you make any of the following control changes:
H Turn off the HOLD function
H Change the measurement function (from VAC to VDC, for
example)
H Change the probe scale factor
H Change the RelD value
H Change the data logger scroll speed
 Loading...