METER Mode
3–44
THS710A, THS720A, THS730A & THS720P User Manual
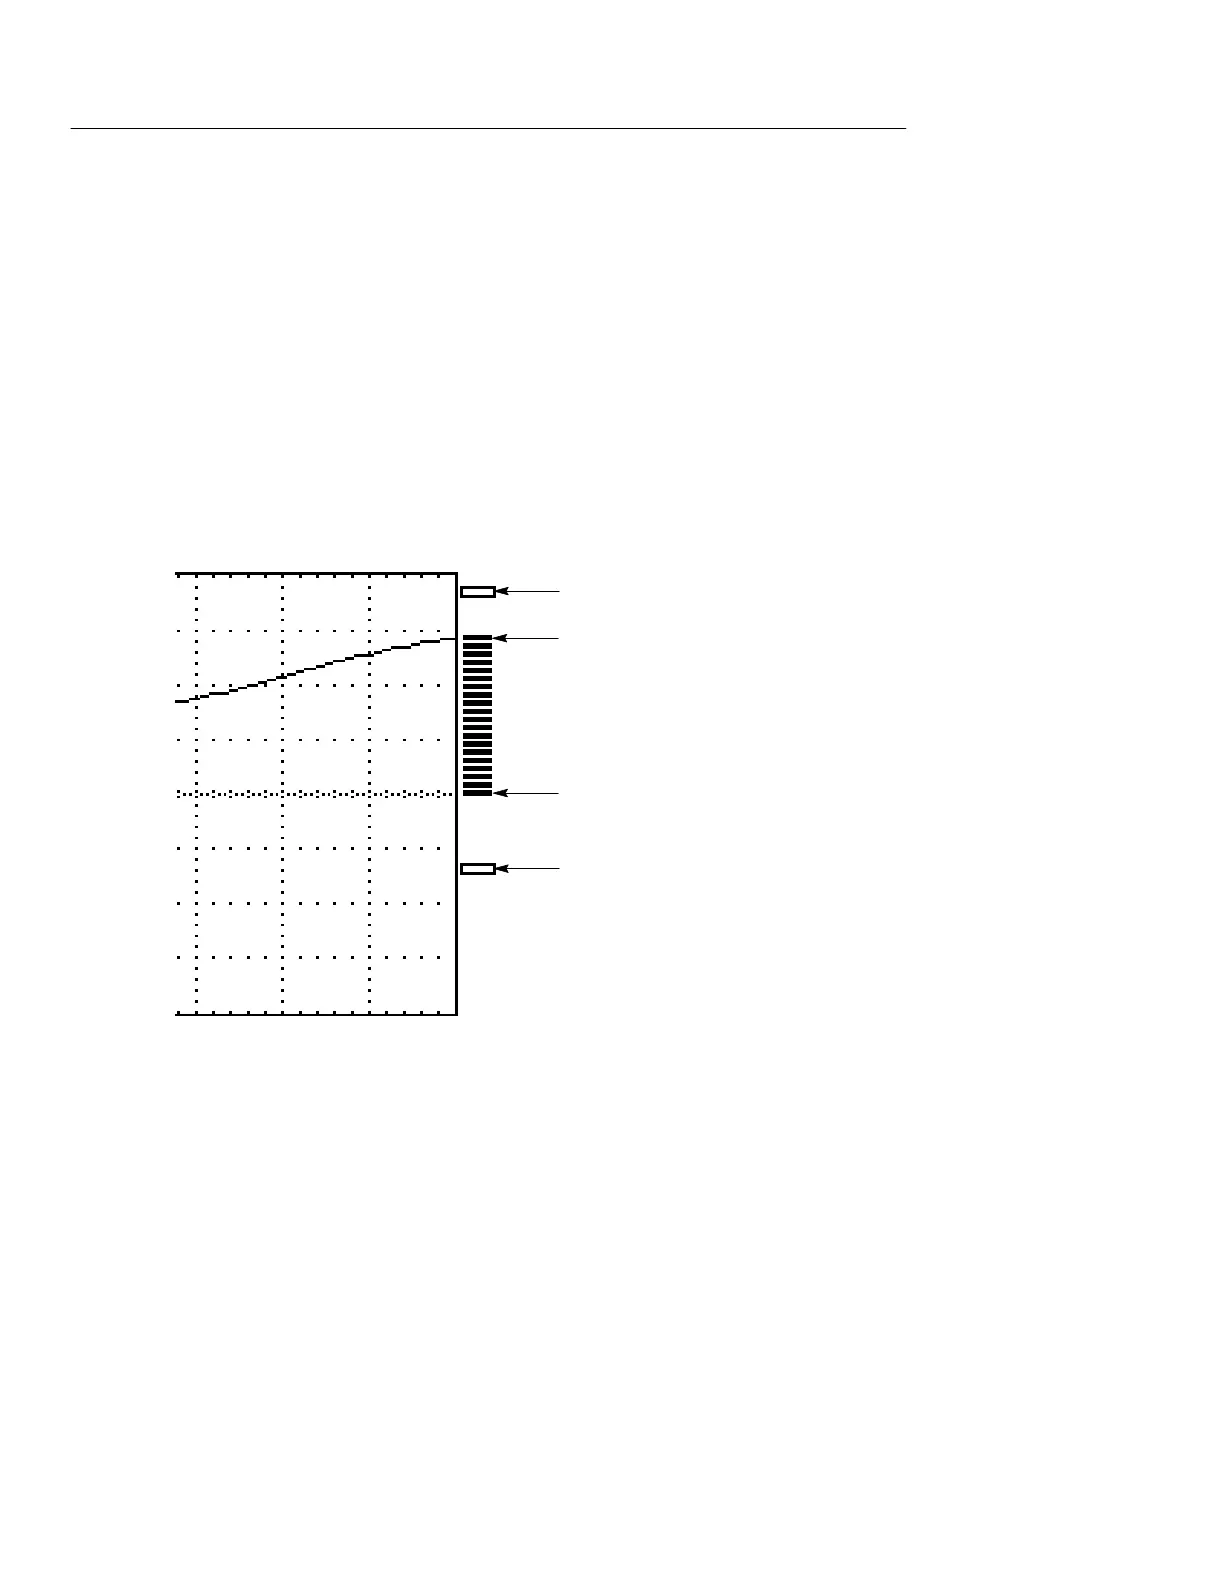
Bar Graph
The rapid update rate of the bar graph simulates an analog meter
movement. The bar graph is displayed just to the right of the data
logger display and uses the vertical axis of the data logger display as
its scale. The bar graph extends from zero (or the RelD baseline
value) to the current meter measurement. It tracks the meter
measurement rate and updates about ten times per second.
In addition, the bar graph contains two hollow segments that
represent the current values of the Min and Max statistics.
Current meter reading
Max statistic
Min statistic
Reference level
For More Information
Many of the other sections in this chapter contain additional
information about meter-mode menus and operation. Please refer to
those sections, which are arranged alphabetically by button name.
 Loading...